Seasonal
Type of resources
Topics
Keywords
Contact for the resource
Provided by
Formats
Representation types
Update frequencies
status
Scale
-

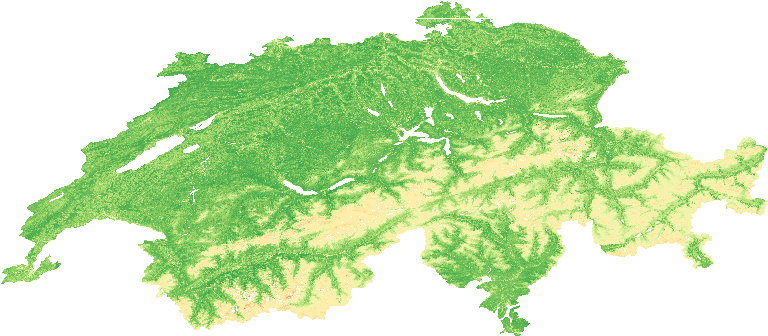
This dataset is a seasonal time-series of Landsat Analysis Ready Data (ARD)-derived Normalized Difference Vegetation Index (NDVI) computed from Landsat 5 Thematic Mapper (TM) and Landsat 8 Opeational Land Imager (OLI). To ensure a consistent dataset, Landsat 7 has not been used because the Scan Line Correct (SLC) failure creates gaps into the data. NDVI quantifies vegetation by measuring the difference between near-infrared (which vegetation strongly reflects) and red light (which vegetation absorbs) using this generic formula: (NIR - R) / (NIR + R) For Landsat sensors, this corresponds to the following bands: Landsat 5, NDVI = (Band 4 – Band 3) / (Band 4 + Band 3). Landsat 8, NDVI = (Band 5 – Band 4) / (Band 5 + Band 4). NDVI values ranges from -1 to +1. NDVI is used to quantify vegetation greenness and is useful in understanding vegetation density and assessing changes in plant health. Standard Deviation is provided in a separate dataset for each time step. Spring: March-April_May (_MAM) Summer: June-July-August (_JJA) Autumn: September-October-November (_SON) Winter: December-January-February (_DJF) Data format: GeoTiff This dataset has been genereated with the Swiss Data Cube (http://www.swissdatacube.ch)
 SwissEnvEO