Vegetation
Type of resources
Available actions
Topics
Keywords
Contact for the resource
Provided by
Formats
Representation types
Update frequencies
status
Scale
-

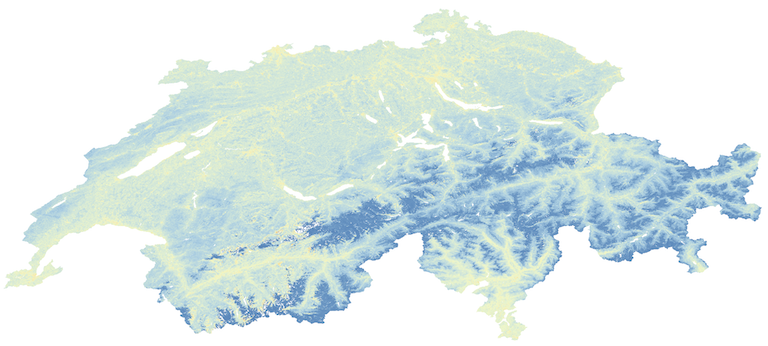
This dataset is an annual time-serie of Landsat Analysis Ready Data (ARD)-derived Normalized Difference Water Index (NDWI) computed from Landsat 5 Thematic Mapper (TM) and Landsat 8 Opeational Land Imager (OLI). To ensure a consistent dataset, Landsat 7 has not been used because the Scan Line Correct (SLC) failure creates gaps into the data. NDWI quantifies plant water content by measuring the difference between Near-Infrared (NIR) and Short Wave Infrared (SWIR) (or Green) channels using this generic formula: (NIR - SWIR) / (NIR + SWIR) For Landsat sensors, this corresponds to the following bands: Landsat 5, NDVI = (Band 4 – Band 2) / (Band 4 + Band 2). Landsat 8, NDVI = (Band 5 – Band 3) / (Band 5 + Band 3). NDWI values ranges from -1 to +1. NDWI is a good proxy for plant water stress and therefore useful for drought monitoring and early warning. NDWI is sometimes alos refered as Normalized Difference Moisture Index (NDMI) Standard Deviation is also provided for each time step. Data format: GeoTiff This dataset has been genereated with the Swiss Data Cube (http://www.swissdatacube.ch)
-

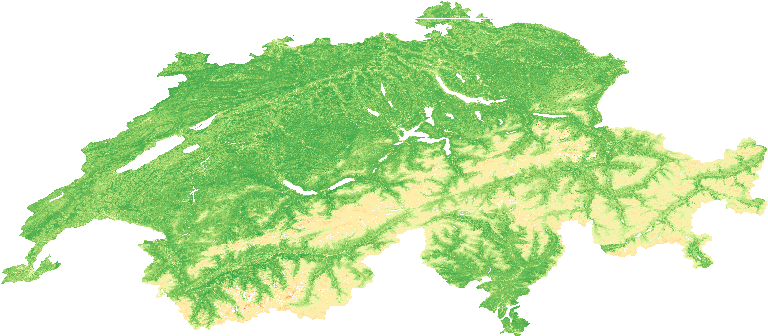
This dataset is an annual time-serie of Landsat Analysis Ready Data (ARD)-derived Normalized Difference Vegetation Index (NDVI) computed from Landsat 5 Thematic Mapper (TM) and Landsat 8 Opeational Land Imager (OLI). To ensure a consistent dataset, Landsat 7 has not been used because the Scan Line Correct (SLC) failure creates gaps into the data. NDVI quantifies vegetation by measuring the difference between near-infrared (which vegetation strongly reflects) and red light (which vegetation absorbs) using this generic formula: (NIR - R) / (NIR + R) For Landsat sensors, this corresponds to the following bands: Landsat 5, NDVI = (Band 4 – Band 3) / (Band 4 + Band 3). Landsat 8, NDVI = (Band 5 – Band 4) / (Band 5 + Band 4). NDVI values ranges from -1 to +1. NDVI is used to quantify vegetation greenness and is useful in understanding vegetation density and assessing changes in plant health. Standard Deviation is also provided for each time step. Data format: GeoTiff This dataset has been genereated with the Swiss Data Cube (http://www.swissdatacube.ch)
-

This dataset is a seasonal time-series of Landsat Analysis Ready Data (ARD)-derived Normalized Difference Vegetation Index (NDVI) computed from Landsat 5 Thematic Mapper (TM) and Landsat 8 Opeational Land Imager (OLI). To ensure a consistent dataset, Landsat 7 has not been used because the Scan Line Correct (SLC) failure creates gaps into the data. NDVI quantifies vegetation by measuring the difference between near-infrared (which vegetation strongly reflects) and red light (which vegetation absorbs) using this generic formula: (NIR - R) / (NIR + R) For Landsat sensors, this corresponds to the following bands: Landsat 5, NDVI = (Band 4 – Band 3) / (Band 4 + Band 3). Landsat 8, NDVI = (Band 5 – Band 4) / (Band 5 + Band 4). NDVI values ranges from -1 to +1. NDVI is used to quantify vegetation greenness and is useful in understanding vegetation density and assessing changes in plant health. Standard Deviation is provided in a separate dataset for each time step. Spring: March-April_May (_MAM) Summer: June-July-August (_JJA) Autumn: September-October-November (_SON) Winter: December-January-February (_DJF) Data format: GeoTiff This dataset has been genereated with the Swiss Data Cube (http://www.swissdatacube.ch)
-

This dataset is a seasonal time-series of Landsat Analysis Ready Data (ARD)-derived Normalized Difference Water Index (NDWI) computed from Landsat 5 Thematic Mapper (TM) and Landsat 8 Opeational Land Imager (OLI). To ensure a consistent dataset, Landsat 7 has not been used because the Scan Line Correct (SLC) failure creates gaps into the data. NDWI quantifies plant water content by measuring the difference between Near-Infrared (NIR) and Short Wave Infrared (SWIR) (or Green) channels using this generic formula: (NIR - SWIR) / (NIR + SWIR) For Landsat sensors, this corresponds to the following bands: Landsat 5, NDVI = (Band 4 – Band 2) / (Band 4 + Band 2). Landsat 8, NDVI = (Band 5 – Band 3) / (Band 5 + Band 3). NDWI values ranges from -1 to +1. NDWI is a good proxy for plant water stress and therefore useful for drought monitoring and early warning. NDWI is sometimes alos refered as Normalized Difference Moisture Index (NDMI) Standard Deviation is provided in a separate dataset for each time step. Spring: March-April_May (_MAM) Summer: June-July-August (_JJA) Autumn: September-October-November (_SON) Winter: December-January-February (_DJF) Data format: GeoTiff This dataset has been genereated with the Swiss Data Cube (http://www.swissdatacube.ch)
 SwissEnvEO