evi
Type of resources
Topics
Keywords
Contact for the resource
Provided by
Representation types
Update frequencies
status
Scale
-

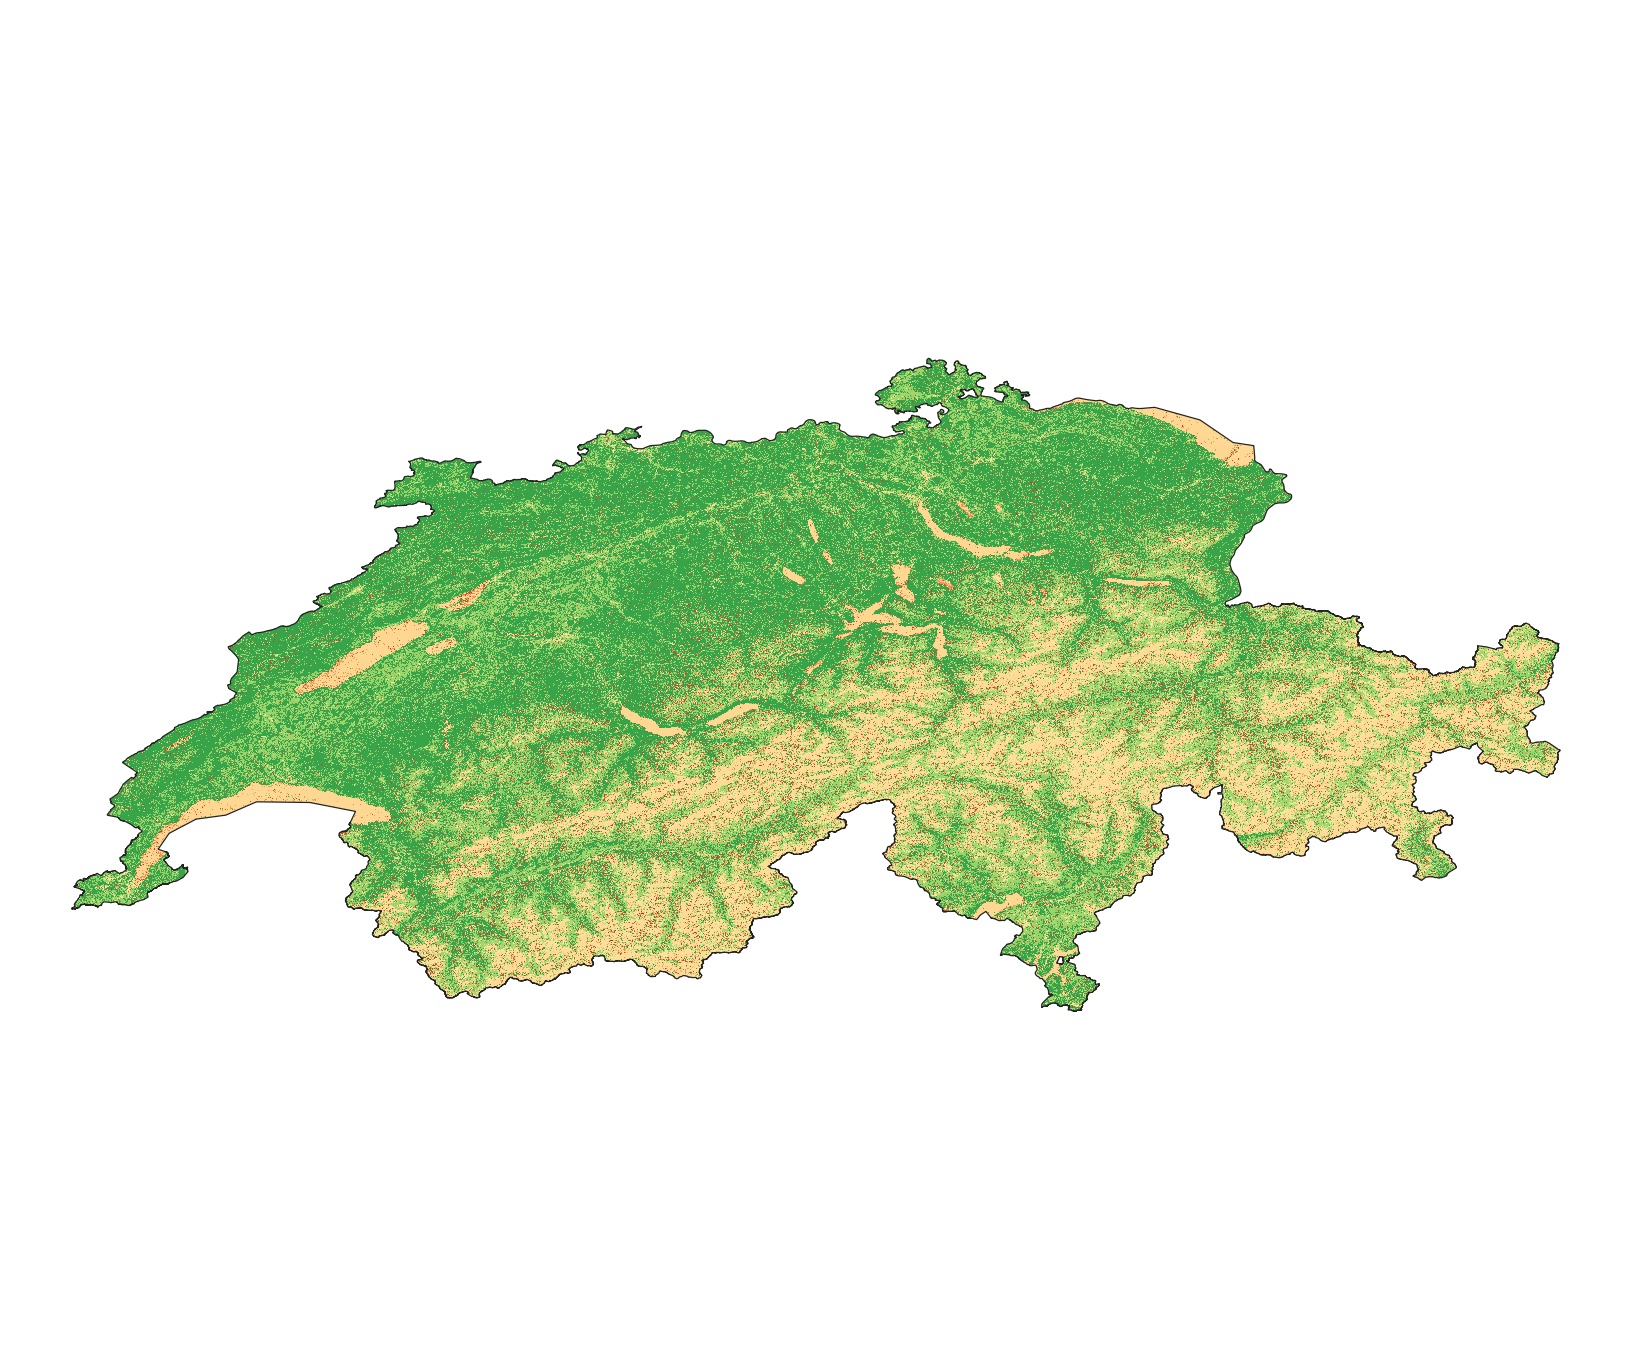
This dataset is an time-serie of Landsat Analysis Ready Data (ARD)- derived Enhanced Vegetation Index (EVI) computed from Landsat 5-7-8 data. EVI quantifies vegetation by measuring the difference between near-infrared (which vegetation strongly reflects) and red light (which vegetation absorbs) using the forumla EVI=2.5*(NIR − Red)/(NIR + 6*Red − 7.5*Blue + 1) . See Huete et al. (2002) DOI: 10.1016/S0034-4257(02)00096-2 EVI values ranges from -1 to +1. Values are provided as integer and multiplied by 1000 Metrics: annual (_annual) and seasonal (_spring; _summer; _autumn; _winter) mean (_nanmean), standard dev (_nanstd), min (_nanmin), max (_nanmax), median (_nanmedian), and amplitude (_range) Data format: GeoTiff
-

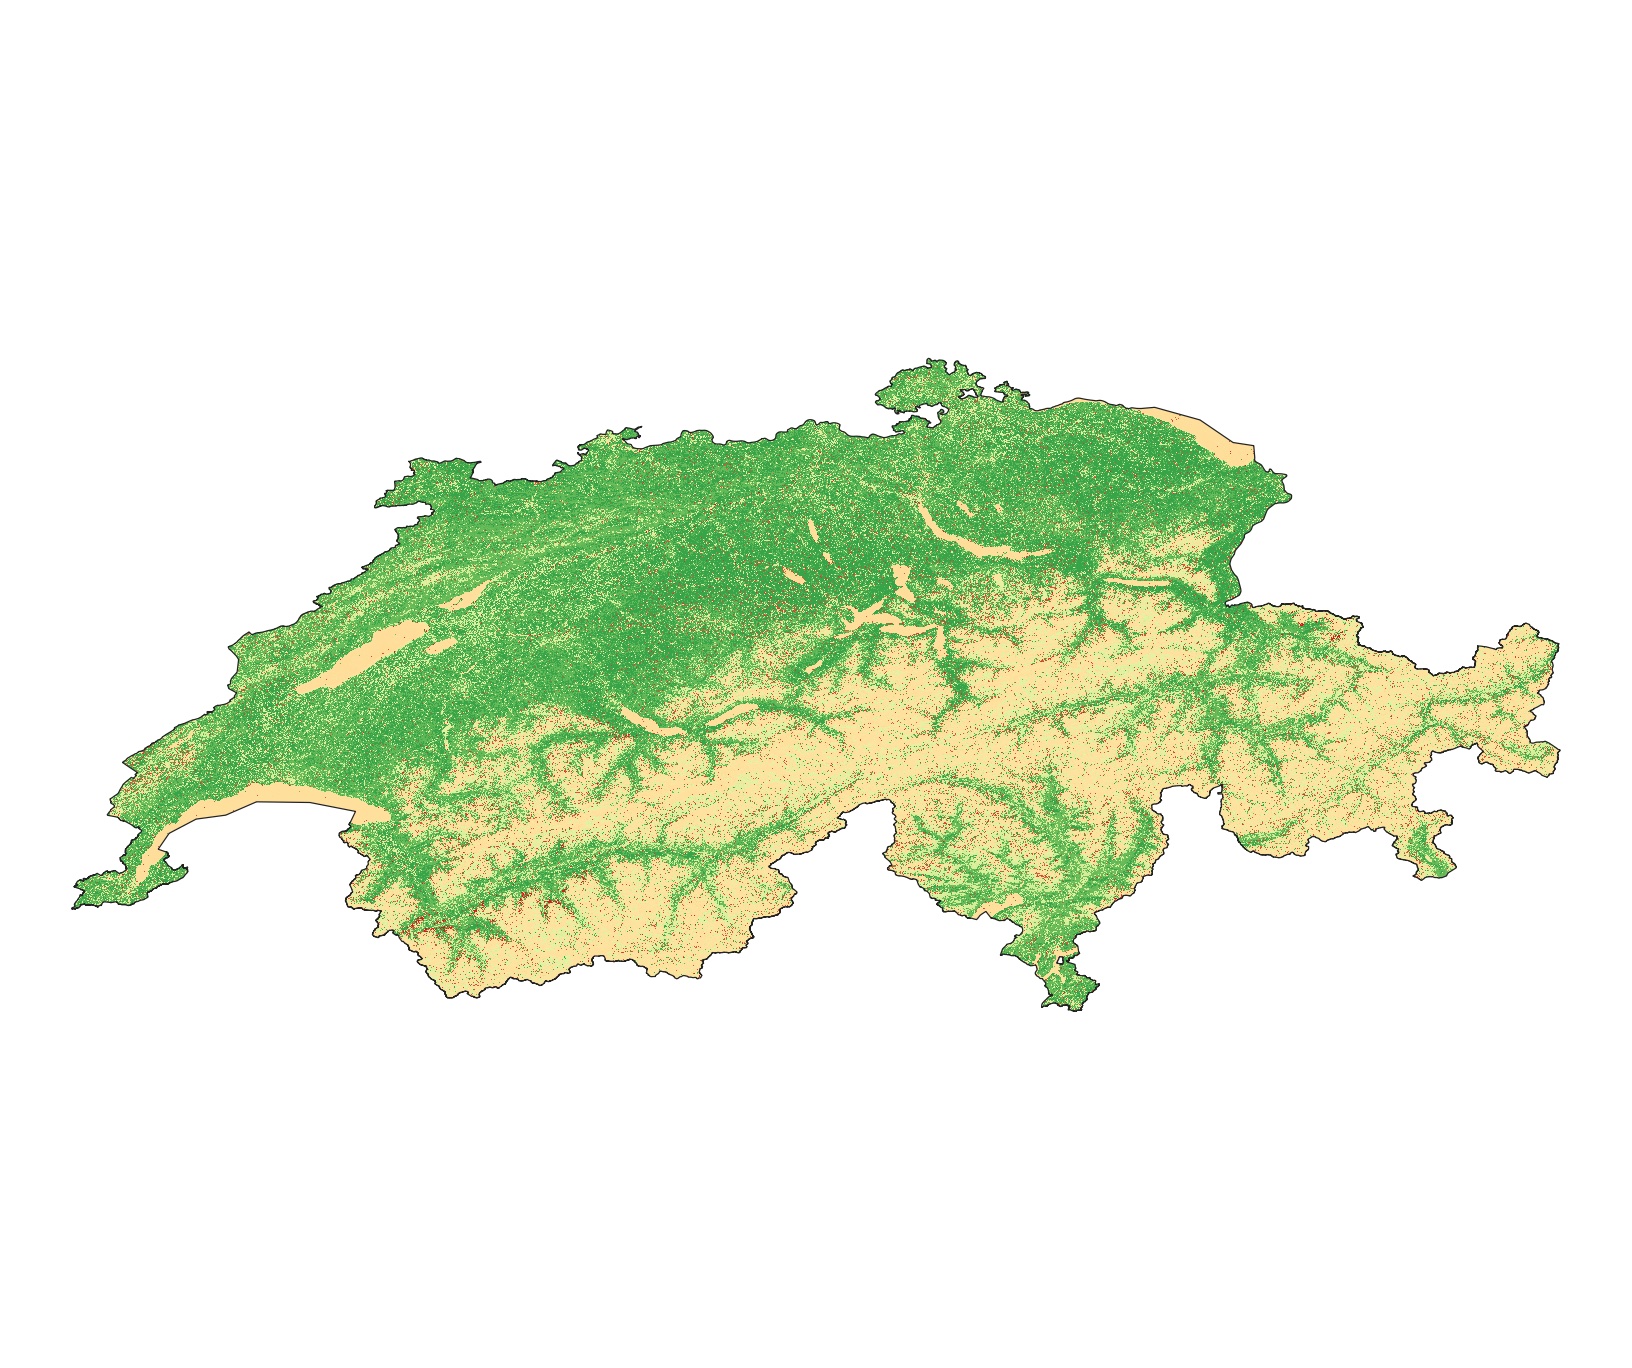
This dataset is an time-serie of Sentinel-2 Analysis Ready Data (ARD)- derived Enhanced Vegetation Index (EVI) computed from Sentinel-2 data. EVI quantifies vegetation by measuring the difference between near-infrared (which vegetation strongly reflects) and red light (which vegetation absorbs) using the forumla EVI=2.5*(b8 − b4)/(b8 + 6*b4 − 7.5*b2 + 1). See Huete et al. (2002) DOI: 10.1016/S0034-4257(02)00096-2 EVI is usually used for areas with high LAI where NDVI is expected to saturate. EVI is used to quantify vegetation greenness and is useful in understanding vegetation density and assessing changes in plant health. EVI values ranges from -1 to +1. Values are provided as integer and multiplied by 1000 Metrics: annual (_annual) and seasonal (_spring; _summer; _autumn; _winter) mean (_nanmean), standard dev (_nanstd), min (_nanmin), max (_nanmax), median (_nanmedian), and amplitude (_range) Data format: GeoTiff
 SwissEnvEO