Landsat
Type of resources
Available actions
Topics
Keywords
Contact for the resource
Provided by
Representation types
Update frequencies
status
Scale
-

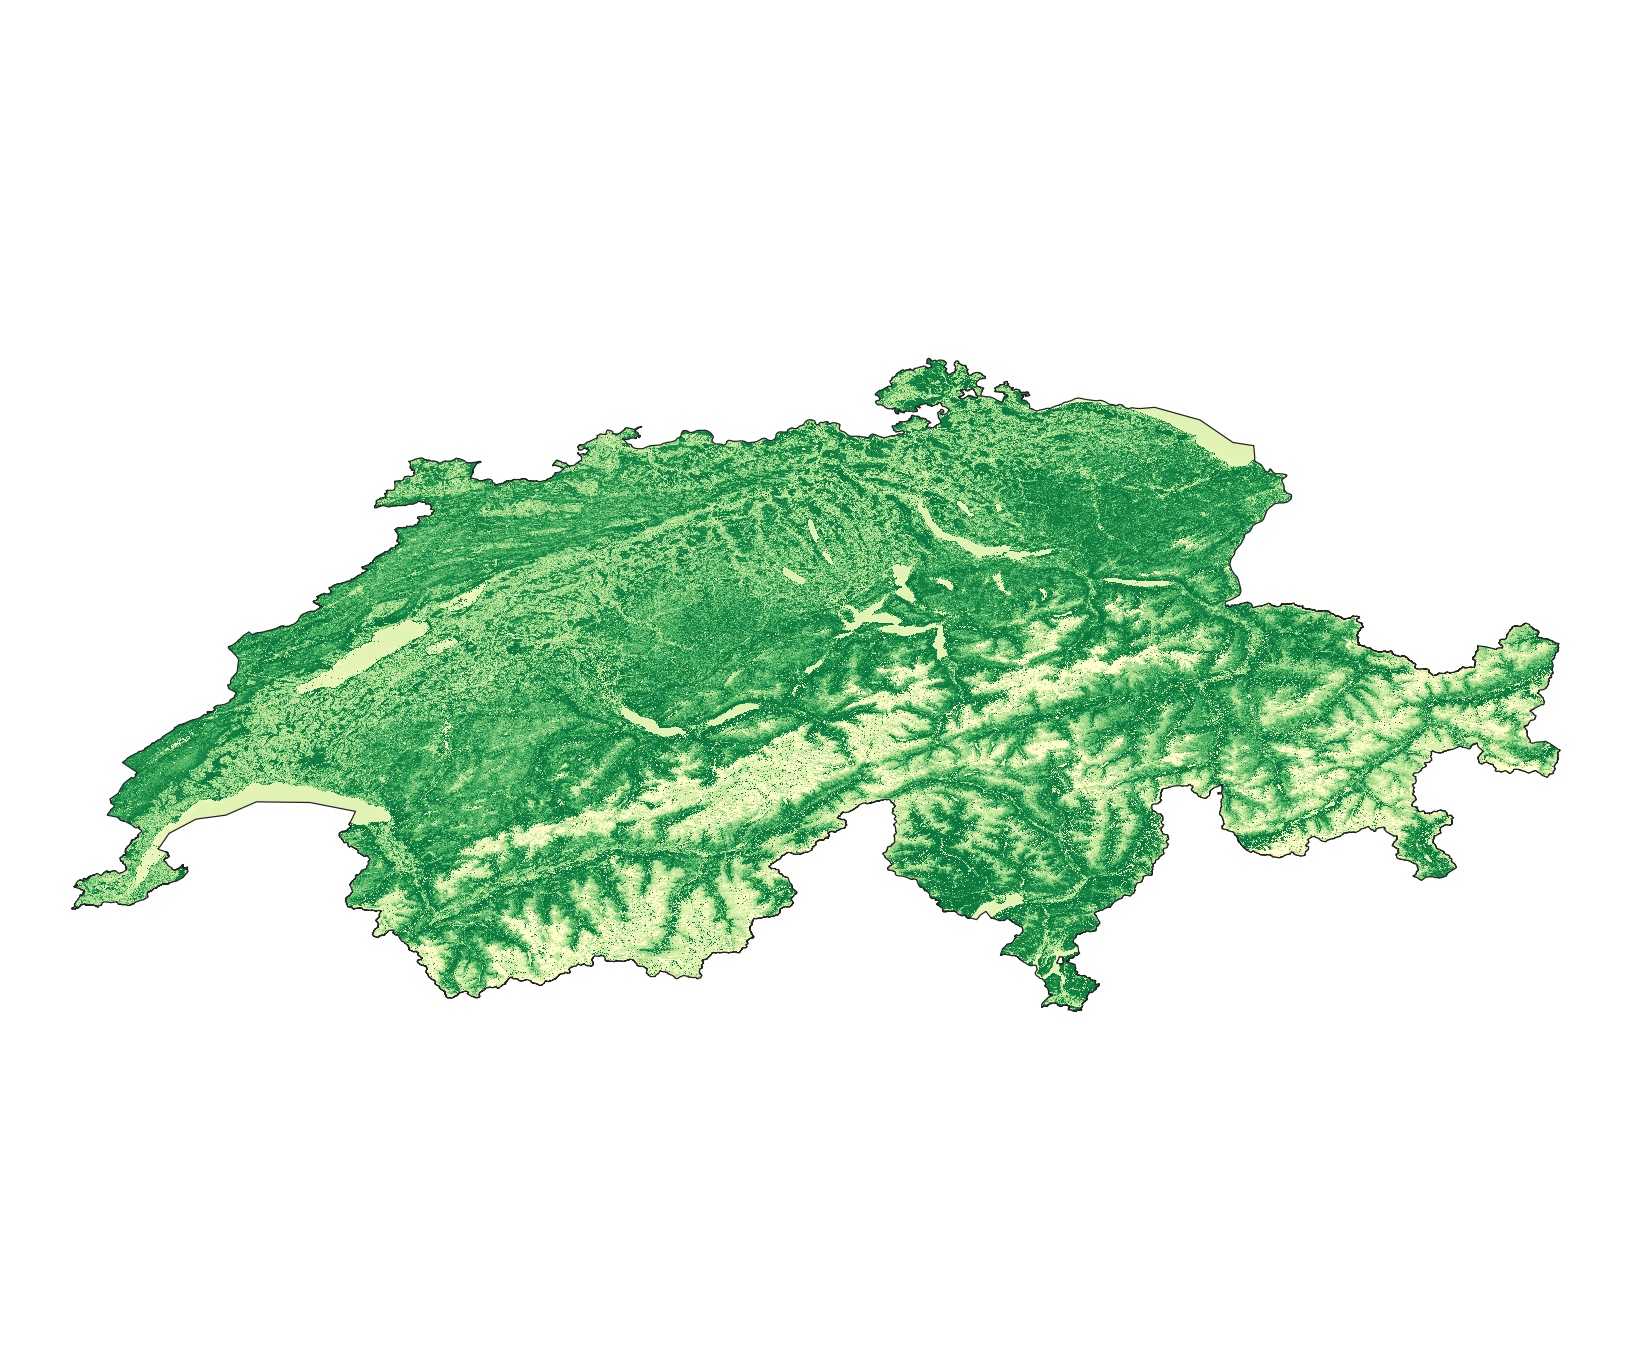
This dataset is an time-serie of Landsat Analysis Ready Data (ARD)- derived Leaf Area Index (LAI) computed from Landsat 5-7-8 data. LAI is designed to analyze the foliage surface of our planet and it estimates the quantity of leaves in a specific region using the forumla LAI= 3.618*EVI - 0.118. For more details see Boegh et al. (2002) DOI: 10.1016/S0034-4257(01)00342-X LAI is a unitless measure that is calculated as the ratio of the one-sided (illuminated) foliage area to the soil surface it can cover. This vegetation index is important to monitor crop and forest health, the environment, and climatic conditions. Values are provided as integer and multiplied by 1000 Metrics: annual (_annual) and seasonal (_spring; _summer; _autumn; _winter) mean (_nanmean), standard dev (_nanstd), min (_nanmin), max (_nanmax), median (_nanmedian), and amplitude (_range) Data format: GeoTiff
-

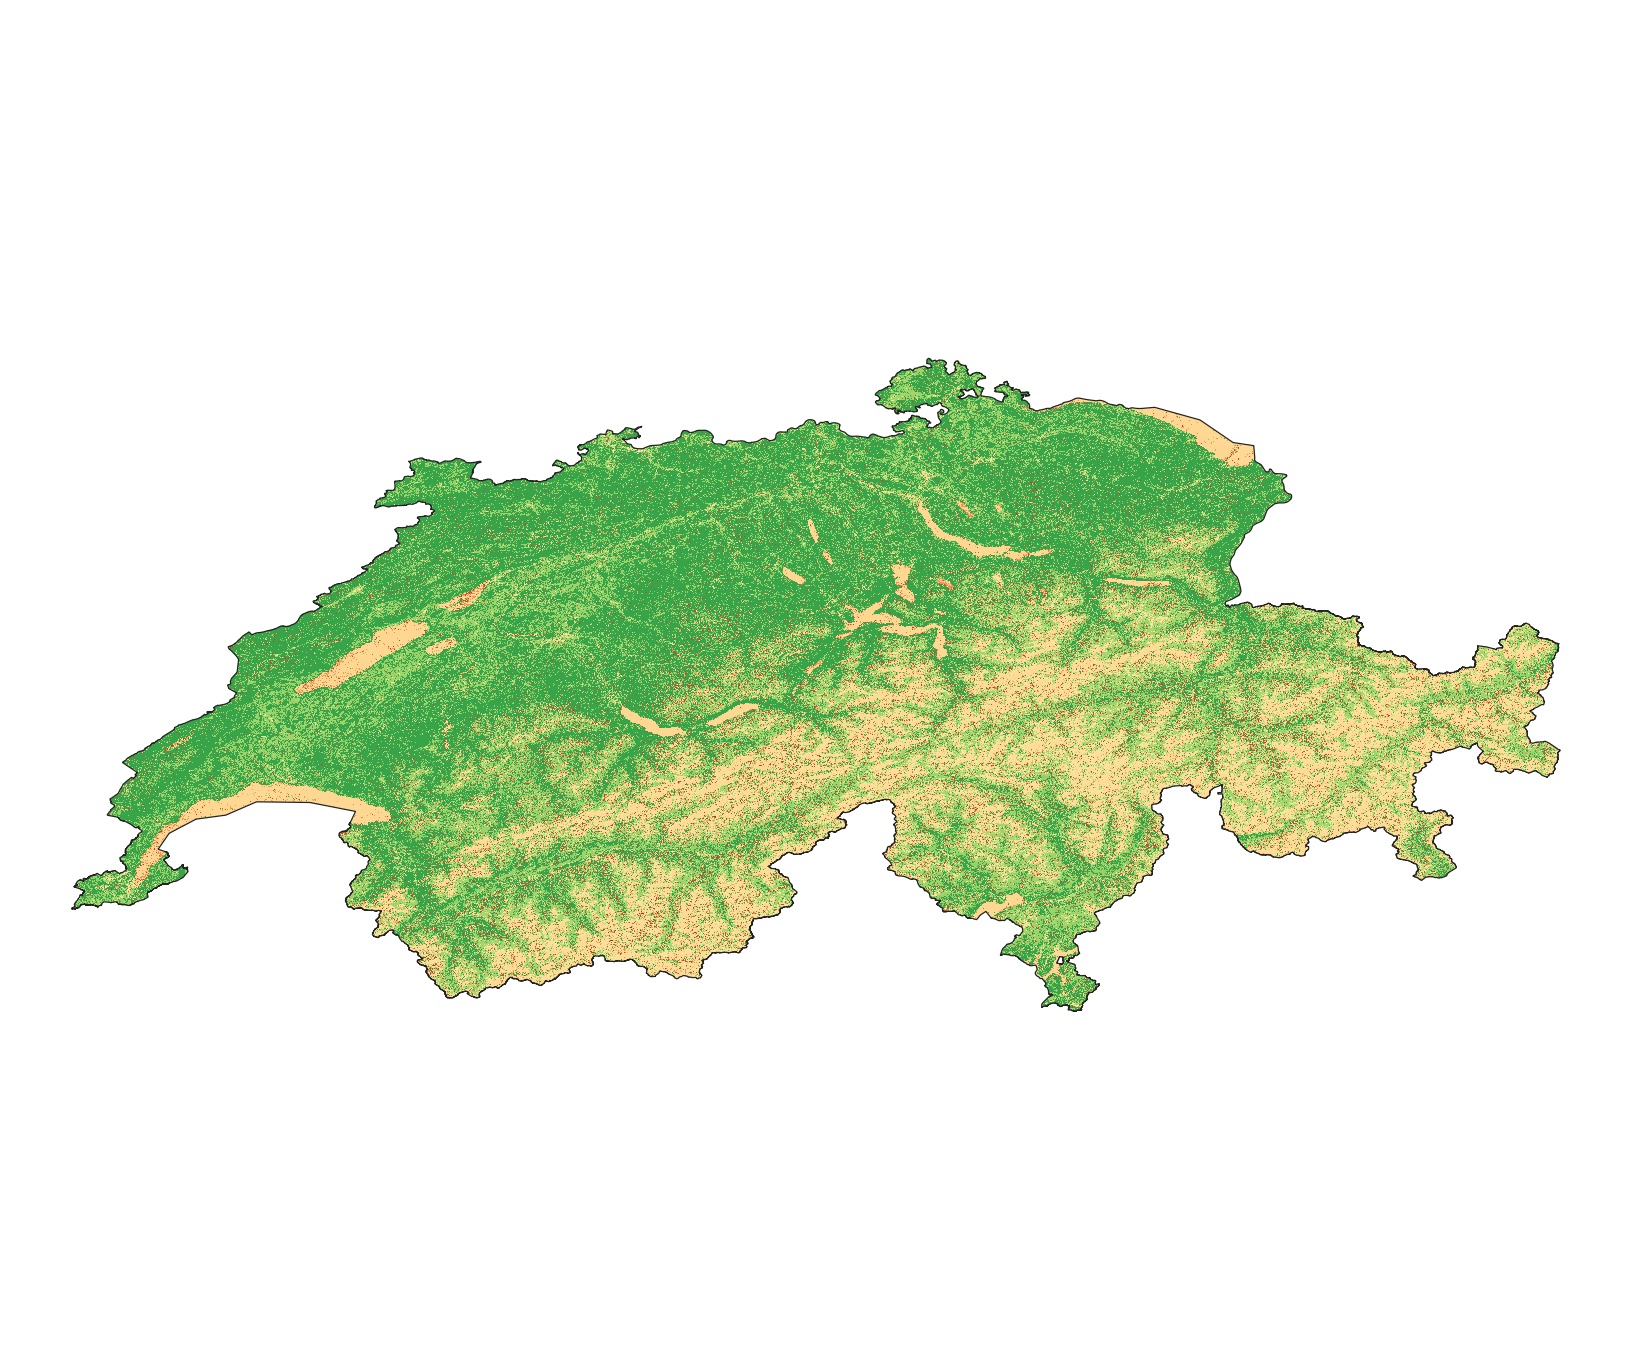
This dataset is an time-serie of Landsat Analysis Ready Data (ARD)- derived Enhanced Vegetation Index (EVI) computed from Landsat 5-7-8 data. EVI quantifies vegetation by measuring the difference between near-infrared (which vegetation strongly reflects) and red light (which vegetation absorbs) using the forumla EVI=2.5*(NIR − Red)/(NIR + 6*Red − 7.5*Blue + 1) . See Huete et al. (2002) DOI: 10.1016/S0034-4257(02)00096-2 EVI values ranges from -1 to +1. Values are provided as integer and multiplied by 1000 Metrics: annual (_annual) and seasonal (_spring; _summer; _autumn; _winter) mean (_nanmean), standard dev (_nanstd), min (_nanmin), max (_nanmax), median (_nanmedian), and amplitude (_range) Data format: GeoTiff
-

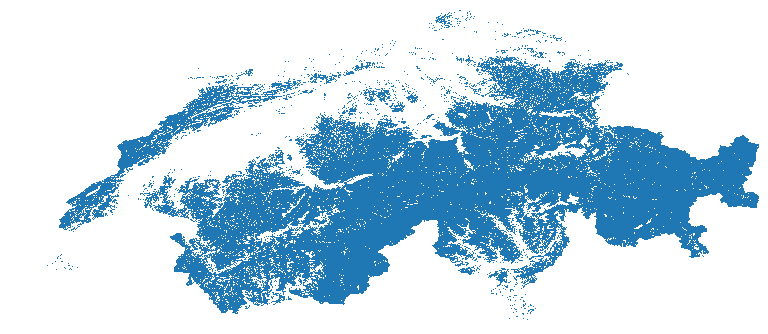
This dataset is a time-series of monthly snow cover maps over Switzerland computed from Landsat & Sentinel-2 Analysis Ready Data (ARD) for December 1984 to December 2021 These maps quantify the presence/absence of snow using the Snow Observation from Space algorithm developed by Poussin et al. in: https://doi.org/10.1016/j.srs.2023.100078 and in a submitted paper (Snow Observation from Space: An approach to map snow cover from four decades of Landsat and Sentinel-2 imageries across Switzerland). Snow cover is an Essential Climate Variables (ECV) playing a significant role in the climate system due to its high albedo and heat insulation. Snow cover also contributes to soil moisture and runoff, making it a crucial variable for monitoring climate change. Values ranges from 0 to 2. The monthly snow cover products have values ranging from 0 to 2 with the following classification for each pixel: • 0 when the pixel is snow-free (i.e., land), • 1 when the pixel is covered with snow, • 2 when the pixel is covered with clouds (including cloud shadow), • NA when the pixel is classified as water or lies outside of Switzerland. Data format: GeoTiff
-

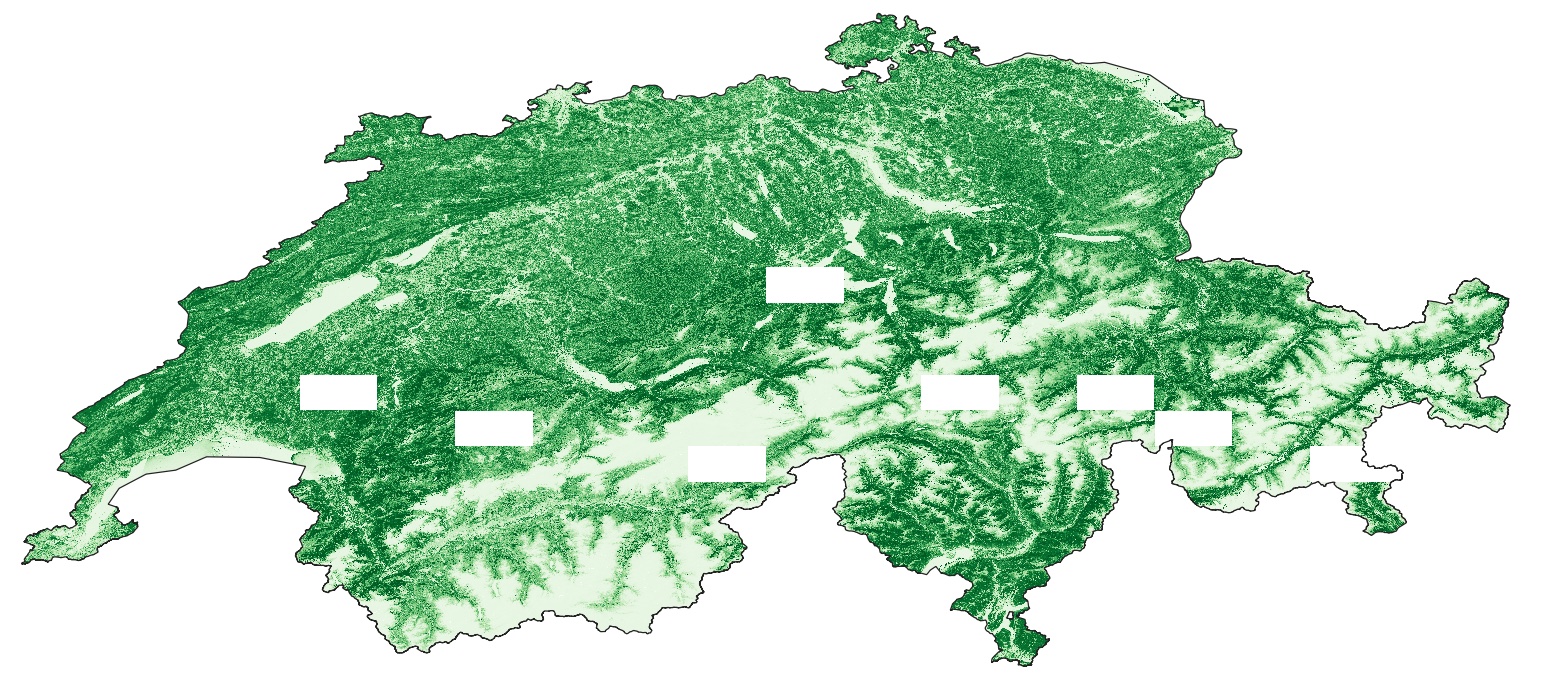
This dataset is an time-serie of Landsat Analysis Ready Data (ARD)- derived Green Chlorophyll Vegetation Index (GCI) computed from Landsat 5-7-8 data. GCI is used to estimate the content of leaf chlorophyll in various species of plants using the forumla GCI=(NIR/Green) – 1. See Gitelson et al. (2003) DOI: 10.1029/2002gl016450 The chlorophyll content reflects the physiological state of vegetation; it decreases in stressed plants and can therefore be used as a measurement of vegetation health. GCI values ranges from -1 to +1. Values are provided as integer and multiplied by 1000 Metrics: annual (_annual) and seasonal (_spring; _summer; _autumn; _winter) mean (_nanmean), standard dev (_nanstd), min (_nanmin), max (_nanmax), median (_nanmedian), and amplitude (_range) Data format: GeoTiff
 SwissEnvEO