 SwissEnvEO
Geoscientific information
Type of resources
Available actions
Topics
Keywords
Contact for the resource
Provided by
Formats
Representation types
Update frequencies
status
Scale
-
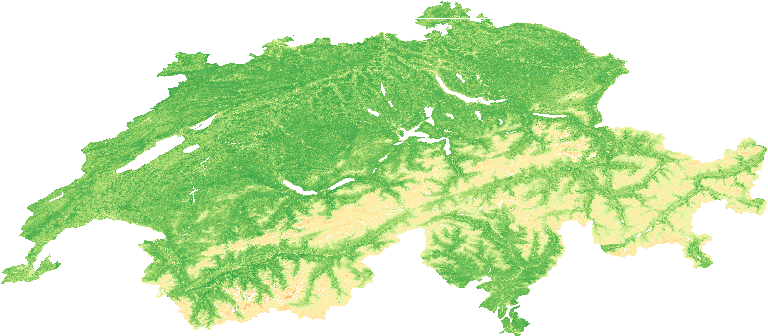
This dataset is a seasonal time-series of Landsat Analysis Ready Data (ARD)-derived Normalized Difference Vegetation Index (NDVI) computed from Landsat 5 Thematic Mapper (TM) and Landsat 8 Opeational Land Imager (OLI). To ensure a consistent dataset, Landsat 7 has not been used because the Scan Line Correct (SLC) failure creates gaps into the data. NDVI quantifies vegetation by measuring the difference between near-infrared (which vegetation strongly reflects) and red light (which vegetation absorbs) using this generic formula: (NIR - R) / (NIR + R) For Landsat sensors, this corresponds to the following bands: Landsat 5, NDVI = (Band 4 – Band 3) / (Band 4 + Band 3). Landsat 8, NDVI = (Band 5 – Band 4) / (Band 5 + Band 4). NDVI values ranges from -1 to +1. NDVI is used to quantify vegetation greenness and is useful in understanding vegetation density and assessing changes in plant health. Standard Deviation is provided in a separate dataset for each time step. Spring: March-April_May (_MAM) Summer: June-July-August (_JJA) Autumn: September-October-November (_SON) Winter: December-January-February (_DJF) Data format: GeoTiff This dataset has been genereated with the Swiss Data Cube (http://www.swissdatacube.ch)
-
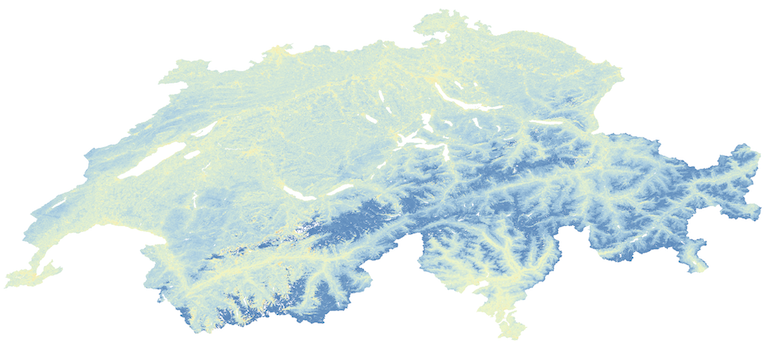
This dataset is a seasonal time-series of Landsat Analysis Ready Data (ARD)-derived Normalized Difference Water Index (NDWI) computed from Landsat 5 Thematic Mapper (TM) and Landsat 8 Opeational Land Imager (OLI). To ensure a consistent dataset, Landsat 7 has not been used because the Scan Line Correct (SLC) failure creates gaps into the data. NDWI quantifies plant water content by measuring the difference between Near-Infrared (NIR) and Short Wave Infrared (SWIR) (or Green) channels using this generic formula: (NIR - SWIR) / (NIR + SWIR) For Landsat sensors, this corresponds to the following bands: Landsat 5, NDVI = (Band 4 – Band 2) / (Band 4 + Band 2). Landsat 8, NDVI = (Band 5 – Band 3) / (Band 5 + Band 3). NDWI values ranges from -1 to +1. NDWI is a good proxy for plant water stress and therefore useful for drought monitoring and early warning. NDWI is sometimes alos refered as Normalized Difference Moisture Index (NDMI) Standard Deviation is provided in a separate dataset for each time step. Spring: March-April_May (_MAM) Summer: June-July-August (_JJA) Autumn: September-October-November (_SON) Winter: December-January-February (_DJF) Data format: GeoTiff This dataset has been genereated with the Swiss Data Cube (http://www.swissdatacube.ch)
-
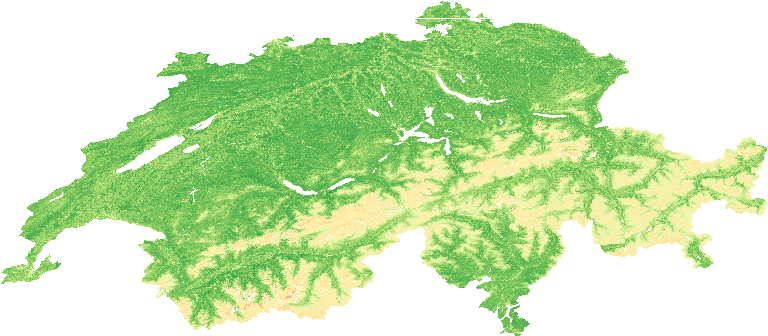
This dataset is an annual time-serie of Landsat Analysis Ready Data (ARD)-derived Normalized Difference Vegetation Index (NDVI) computed from Landsat 5 Thematic Mapper (TM) and Landsat 8 Opeational Land Imager (OLI). To ensure a consistent dataset, Landsat 7 has not been used because the Scan Line Correct (SLC) failure creates gaps into the data. NDVI quantifies vegetation by measuring the difference between near-infrared (which vegetation strongly reflects) and red light (which vegetation absorbs) using this generic formula: (NIR - R) / (NIR + R) For Landsat sensors, this corresponds to the following bands: Landsat 5, NDVI = (Band 4 – Band 3) / (Band 4 + Band 3). Landsat 8, NDVI = (Band 5 – Band 4) / (Band 5 + Band 4). NDVI values ranges from -1 to +1. NDVI is used to quantify vegetation greenness and is useful in understanding vegetation density and assessing changes in plant health. Standard Deviation is also provided for each time step. Data format: GeoTiff This dataset has been genereated with the Swiss Data Cube (http://www.swissdatacube.ch)
-
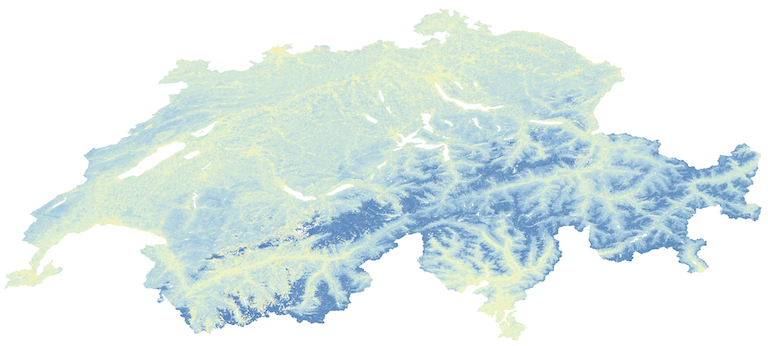
This dataset is an annual time-serie of Landsat Analysis Ready Data (ARD)-derived Normalized Difference Water Index (NDWI) computed from Landsat 5 Thematic Mapper (TM) and Landsat 8 Opeational Land Imager (OLI). To ensure a consistent dataset, Landsat 7 has not been used because the Scan Line Correct (SLC) failure creates gaps into the data. NDWI quantifies plant water content by measuring the difference between Near-Infrared (NIR) and Short Wave Infrared (SWIR) (or Green) channels using this generic formula: (NIR - SWIR) / (NIR + SWIR) For Landsat sensors, this corresponds to the following bands: Landsat 5, NDVI = (Band 4 – Band 2) / (Band 4 + Band 2). Landsat 8, NDVI = (Band 5 – Band 3) / (Band 5 + Band 3). NDWI values ranges from -1 to +1. NDWI is a good proxy for plant water stress and therefore useful for drought monitoring and early warning. NDWI is sometimes alos refered as Normalized Difference Moisture Index (NDMI) Standard Deviation is also provided for each time step. Data format: GeoTiff This dataset has been genereated with the Swiss Data Cube (http://www.swissdatacube.ch)
-
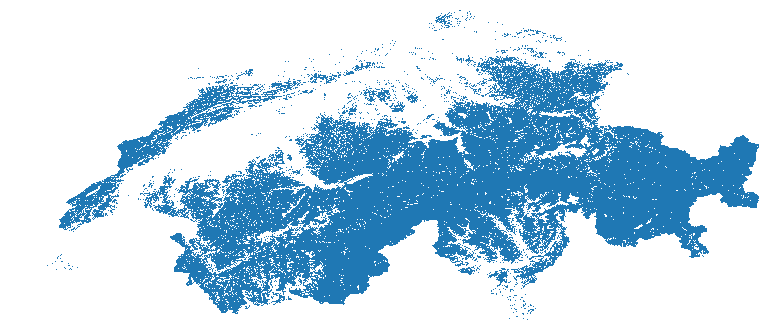
This dataset is a time-series of monthly snow cover maps over Switzerland computed from Landsat & Sentinel-2 Analysis Ready Data (ARD) for December 1984 to December 2021 These maps quantify the presence/absence of snow using the Snow Observation from Space algorithm developed by Poussin et al. in: https://doi.org/10.1016/j.srs.2023.100078 and in a submitted paper (Snow Observation from Space: An approach to map snow cover from four decades of Landsat and Sentinel-2 imageries across Switzerland). Snow cover is an Essential Climate Variables (ECV) playing a significant role in the climate system due to its high albedo and heat insulation. Snow cover also contributes to soil moisture and runoff, making it a crucial variable for monitoring climate change. Values ranges from 0 to 2. The monthly snow cover products have values ranging from 0 to 2 with the following classification for each pixel: • 0 when the pixel is snow-free (i.e., land), • 1 when the pixel is covered with snow, • 2 when the pixel is covered with clouds (including cloud shadow), • NA when the pixel is classified as water or lies outside of Switzerland. Data format: GeoTiff
-
This dataset is an time-serie of Sentinel-2 Analysis Ready Data (ARD)- derived Moisture Stress Index (MSI) computed from Sentinel-2 data. MSI is a reflectance measurement, sensitive to increases in leaf water content using the forumla MSI=b11/b8. See Rock et al. (1985) DOI: As water content in vegetation canopy leaves increases, the absorbtion at wavelengths around 1599 nm also increases. Absorption at 819nm is used as a reference, since it’s nearly unaffected by changes in water content. Applications of the MSI include canopy stress analysis, productivity prediction and modelling, fire hazard analysis, and studies of ecosystem physiology. The index is inverted relative to the other water vegetation indices; higher values indicate greater water stress and less water content. The values of this index range from 0 to more than 3. The common range for green vegetation is 0.4 to 2. Values are provided as integer and multiplied by 1000 Metrics: annual (_annual) and seasonal (_spring; _summer; _autumn; _winter) mean (_nanmean), standard dev (_nanstd), min (_nanmin), max (_nanmax), median (_nanmedian), and amplitude (_range) Data format: GeoTiff
-
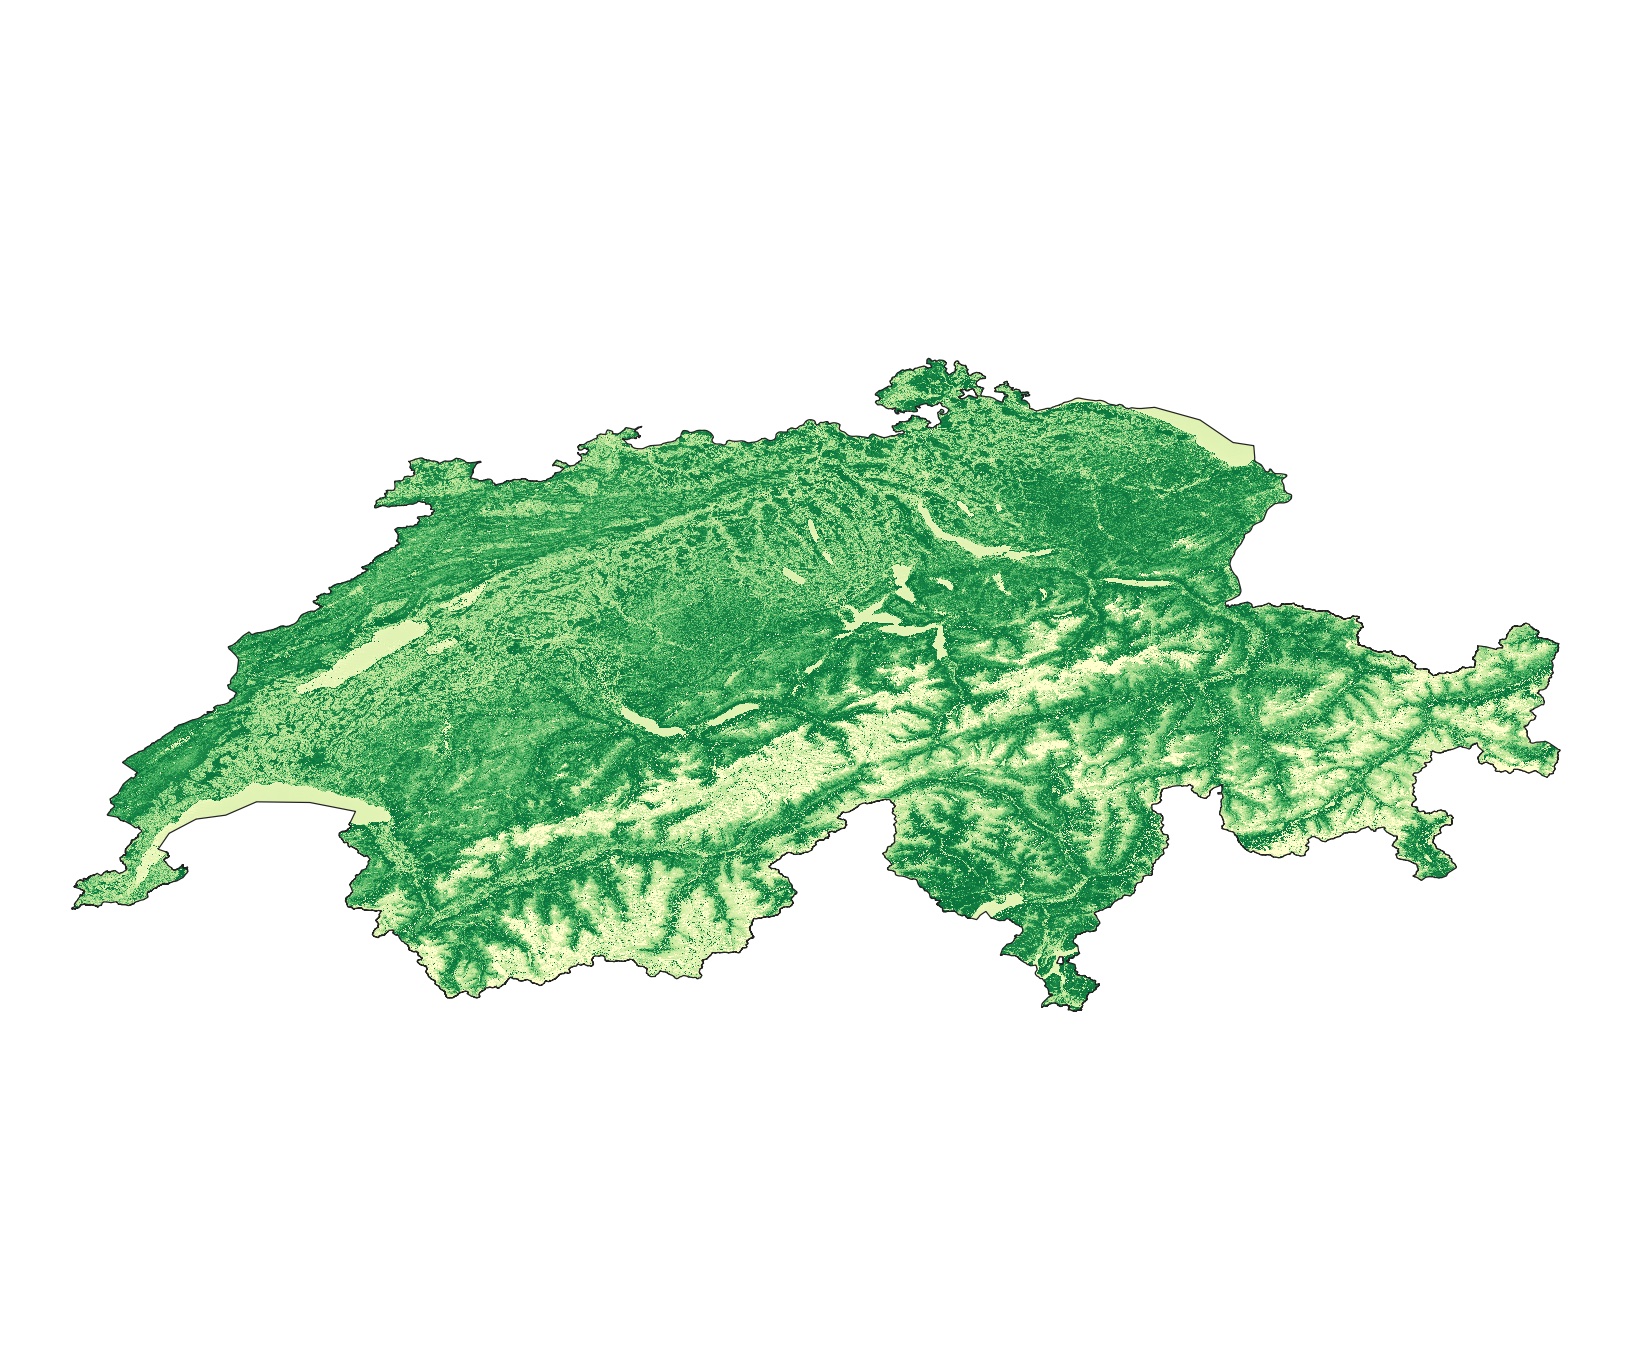
This dataset is an time-serie of Landsat Analysis Ready Data (ARD)- derived Leaf Area Index (LAI) computed from Landsat 5-7-8 data. LAI is designed to analyze the foliage surface of our planet and it estimates the quantity of leaves in a specific region using the forumla LAI= 3.618*EVI - 0.118. For more details see Boegh et al. (2002) DOI: 10.1016/S0034-4257(01)00342-X LAI is a unitless measure that is calculated as the ratio of the one-sided (illuminated) foliage area to the soil surface it can cover. This vegetation index is important to monitor crop and forest health, the environment, and climatic conditions. Values are provided as integer and multiplied by 1000 Metrics: annual (_annual) and seasonal (_spring; _summer; _autumn; _winter) mean (_nanmean), standard dev (_nanstd), min (_nanmin), max (_nanmax), median (_nanmedian), and amplitude (_range) Data format: GeoTiff
-
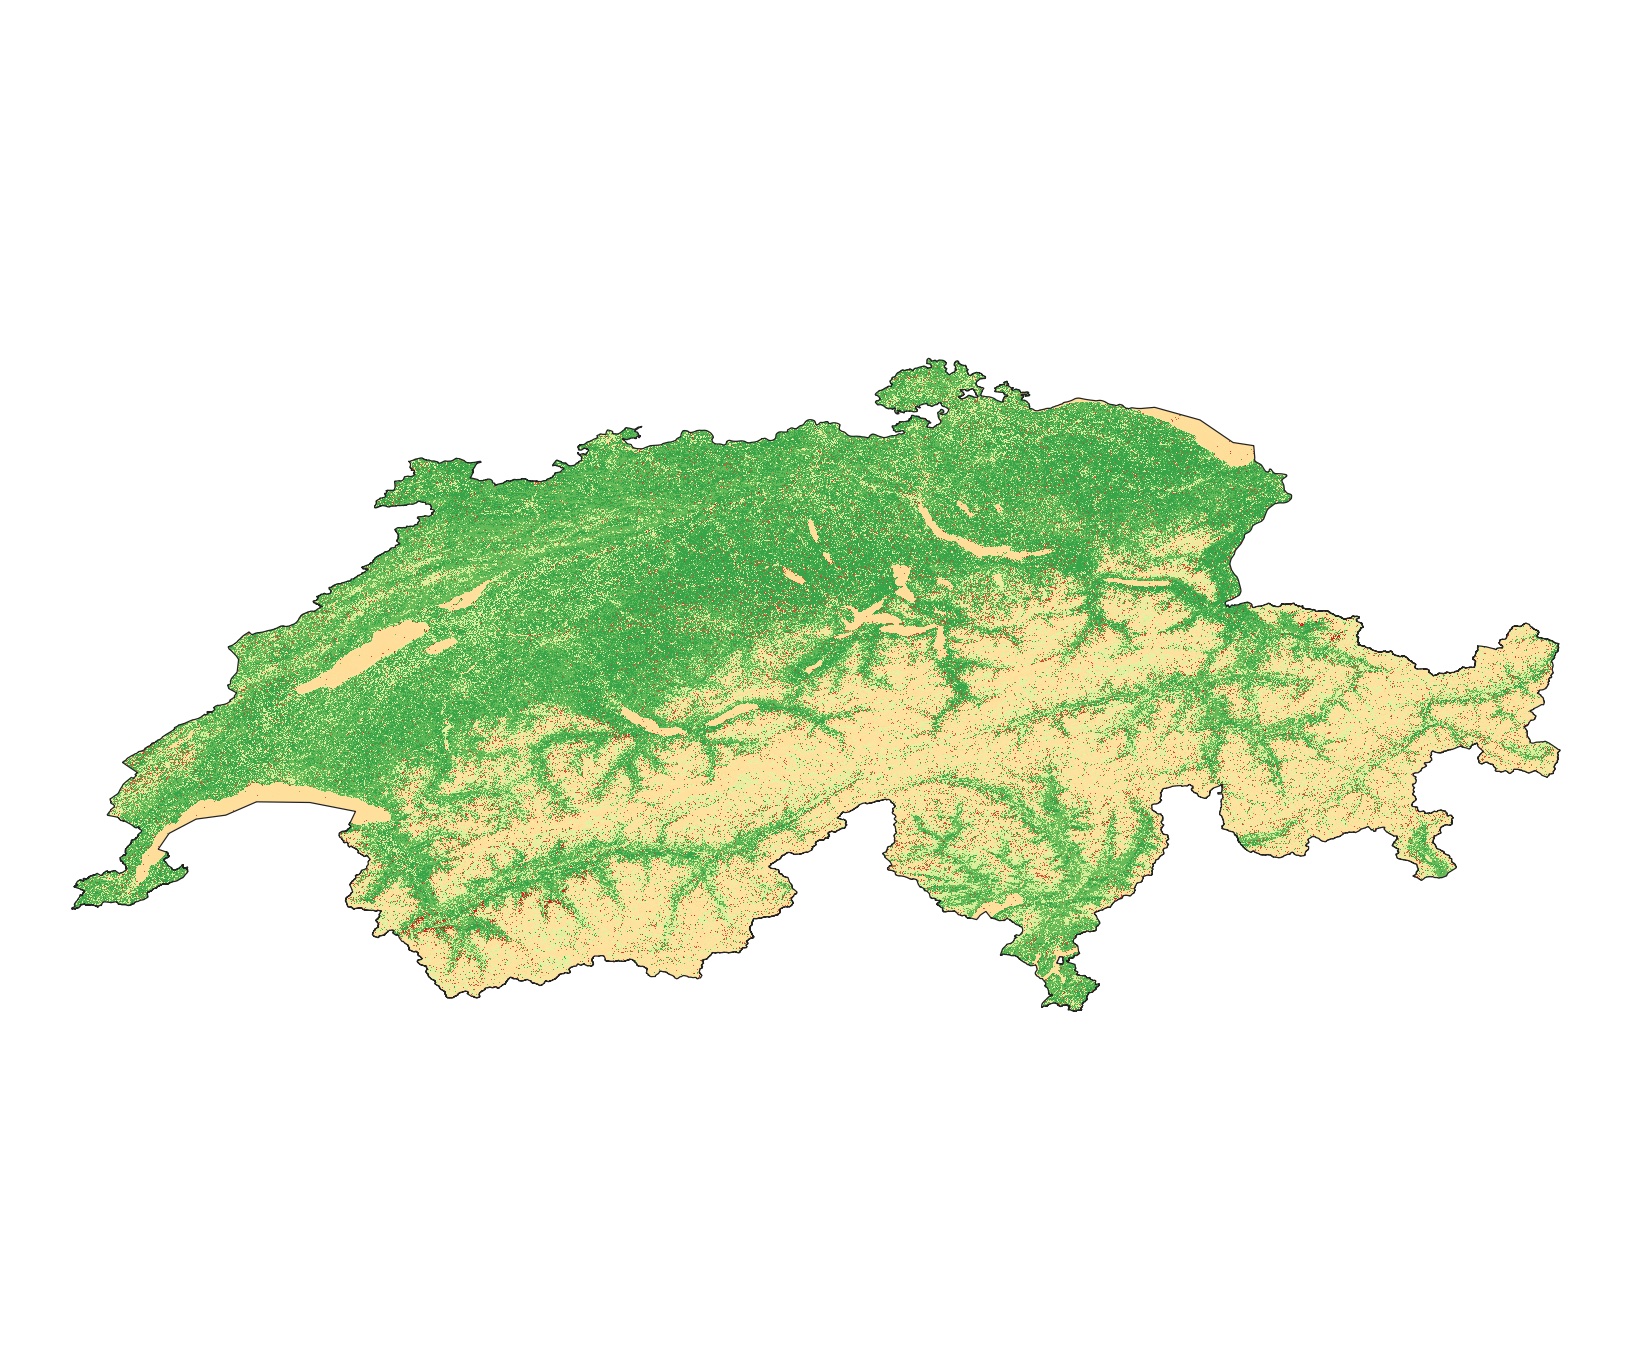
This dataset is an time-serie of Sentinel-2 Analysis Ready Data (ARD)- derived Enhanced Vegetation Index (EVI) computed from Sentinel-2 data. EVI quantifies vegetation by measuring the difference between near-infrared (which vegetation strongly reflects) and red light (which vegetation absorbs) using the forumla EVI=2.5*(b8 − b4)/(b8 + 6*b4 − 7.5*b2 + 1). See Huete et al. (2002) DOI: 10.1016/S0034-4257(02)00096-2 EVI is usually used for areas with high LAI where NDVI is expected to saturate. EVI is used to quantify vegetation greenness and is useful in understanding vegetation density and assessing changes in plant health. EVI values ranges from -1 to +1. Values are provided as integer and multiplied by 1000 Metrics: annual (_annual) and seasonal (_spring; _summer; _autumn; _winter) mean (_nanmean), standard dev (_nanstd), min (_nanmin), max (_nanmax), median (_nanmedian), and amplitude (_range) Data format: GeoTiff
-
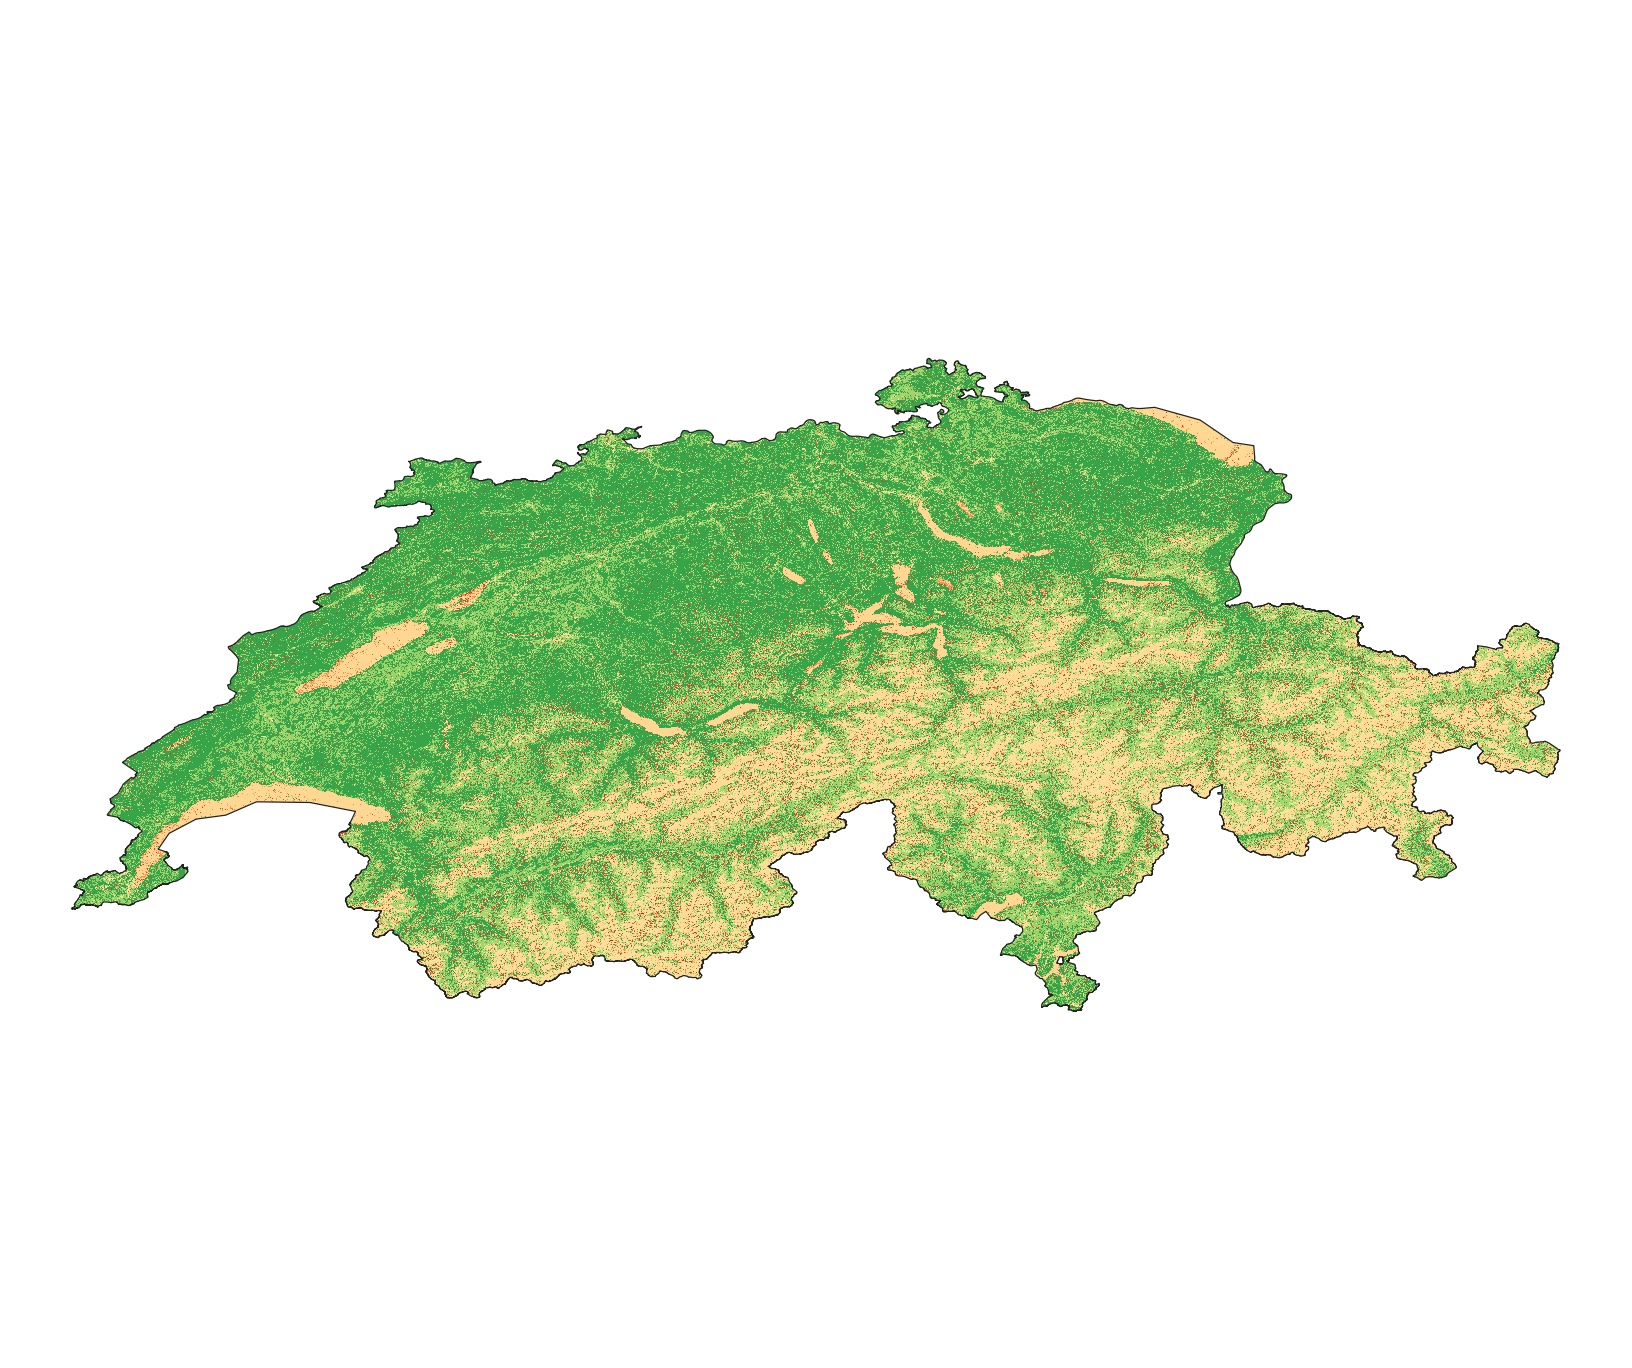
This dataset is an time-serie of Landsat Analysis Ready Data (ARD)- derived Enhanced Vegetation Index (EVI) computed from Landsat 5-7-8 data. EVI quantifies vegetation by measuring the difference between near-infrared (which vegetation strongly reflects) and red light (which vegetation absorbs) using the forumla EVI=2.5*(NIR − Red)/(NIR + 6*Red − 7.5*Blue + 1) . See Huete et al. (2002) DOI: 10.1016/S0034-4257(02)00096-2 EVI values ranges from -1 to +1. Values are provided as integer and multiplied by 1000 Metrics: annual (_annual) and seasonal (_spring; _summer; _autumn; _winter) mean (_nanmean), standard dev (_nanstd), min (_nanmin), max (_nanmax), median (_nanmedian), and amplitude (_range) Data format: GeoTiff
-

This dataset is the Sentinel-2 Analysis Ready Data (ARD) - Level 2 (surface reflectance) archive for Switzerland. Detailed description about the Sentinel-2 missions can be found in the CEOS Earth Observation Handbook: Sentinel-2 A http://database.eohandbook.com/database/missionsummary.aspx?missionID=552 and Sentinel-2 B http://database.eohandbook.com/database/missionsummary.aspx?missionID=553. Switzerland is covered by twelve Sentinel-2 scenes (ID: 31TGM, 31TGN, 32TLR, 32TLS, 32TLT, 32TMR, 32TMS, 32TMT, 32TNS, 32TNT, 32TPS, 32TPT). This corresponds to a spatial extent of latitude 45.0 to 47.9N, longitude 5.5 to 11.8E. Data are downloaded as L1C products corresponding to 100x100km2 geometrically corrected Top Of the Atmosphere (TOA) tiles. Atmospheric corrections are applied to generate normalized surface reflectance that correspond to the ARD level (i.e., Level 2A). For that, we use the ESA Sen2Cor algorithm (http://step.esa.int/main/third-party-plugins-2/sen2cor/)38 version 2.5.5 (2.8.0 version is not used as it is not able to process products before 2017). The algorithm follows two steps to pre-process data: first, it executes an image classification to identify and generate masks of clouds, cloud shadows, snow and water. Second, it applies an atmospheric correction model to convert TOA values into surface reflectance. Sen2Cor provides additional outputs on Aerosol Optical Thickness (AOT) and Water Vapour (WV). In the S2 ARD workflow, all bands are pre-processed and ingested except the band 10 that is only used for atmospheric corrections and consequently not relevant for users. It is important to mention that topographic correction is not applied as it creates strong artefacts. Sentinel-2 processed to level 2A with Sen2Cor comes with a scene classification (similar to the pixel_qa band provided by USGS for Landsat data) with 12 classes as described at: https://earth.esa.int/web/sentinel/technical-guides/sentinel-2-msi/level-2a/algorithm. It helps identifying pixels that are saturated or defective as well as cloud and cloud shadows that may affect the quality of the images. In addition, ESA provides a monthly status of the quality of Sentinel-2 data through Data Quality Reports (DQR). These reports document geometric and radiometric performances against initial sensor specifications together with observed anomalies and issues. DQR are available at: https://sentinels.copernicus.eu/web/sentinel/data-product-quality-reports.