Imagery base maps earth cover
Type of resources
Available actions
Topics
Keywords
Contact for the resource
Provided by
Formats
Representation types
Update frequencies
status
Scale
-
This dataset is an time-serie of Sentinel-2 Analysis Ready Data (ARD)- derived Anthocyanin Reflectance Index (ARI) computed from Sentinel-2 data. ARI is is a reflectance measurement, sensitive to vegetation pigment content using the forumla ARI = (1/b3) - (1/b5). See Gitelson et al. (2009) DOI: 10.3732/ajb.0800395. Anthocyanins are pigments common in higher plants, causing their red, blue and purple coloration. They provide valuable information about the physiological status of plants, as they are considered indicators of various types of plant stresses. The reflectance of anthocyanin is highest around 550nm. However, the same wavelengths are reflected by chlorophyll as well. To isolate the anthocyanins, the 700nm spectral band, that reflects only chlorophyll and not anthocyanins, is subtracted. ARI values for the examined trees in this original article ranged in values from 0 to 0.2. Values are provided as integer and multiplied by 1000 Metrics: annual (_annual) and seasonal (_spring; _summer; _autumn; _winter) mean (_nanmean), standard dev (_nanstd), min (_nanmin), max (_nanmax), median (_nanmedian), and amplitude (_range) Data format: GeoTiff
-
This dataset is an time-serie of Sentinel-2 Analysis Ready Data (ARD)- derived Moisture Stress Index (MSI) computed from Sentinel-2 data. MSI is a reflectance measurement, sensitive to increases in leaf water content using the forumla MSI=b11/b8. See Rock et al. (1985) DOI: As water content in vegetation canopy leaves increases, the absorbtion at wavelengths around 1599 nm also increases. Absorption at 819nm is used as a reference, since it’s nearly unaffected by changes in water content. Applications of the MSI include canopy stress analysis, productivity prediction and modelling, fire hazard analysis, and studies of ecosystem physiology. The index is inverted relative to the other water vegetation indices; higher values indicate greater water stress and less water content. The values of this index range from 0 to more than 3. The common range for green vegetation is 0.4 to 2. Values are provided as integer and multiplied by 1000 Metrics: annual (_annual) and seasonal (_spring; _summer; _autumn; _winter) mean (_nanmean), standard dev (_nanstd), min (_nanmin), max (_nanmax), median (_nanmedian), and amplitude (_range) Data format: GeoTiff
-
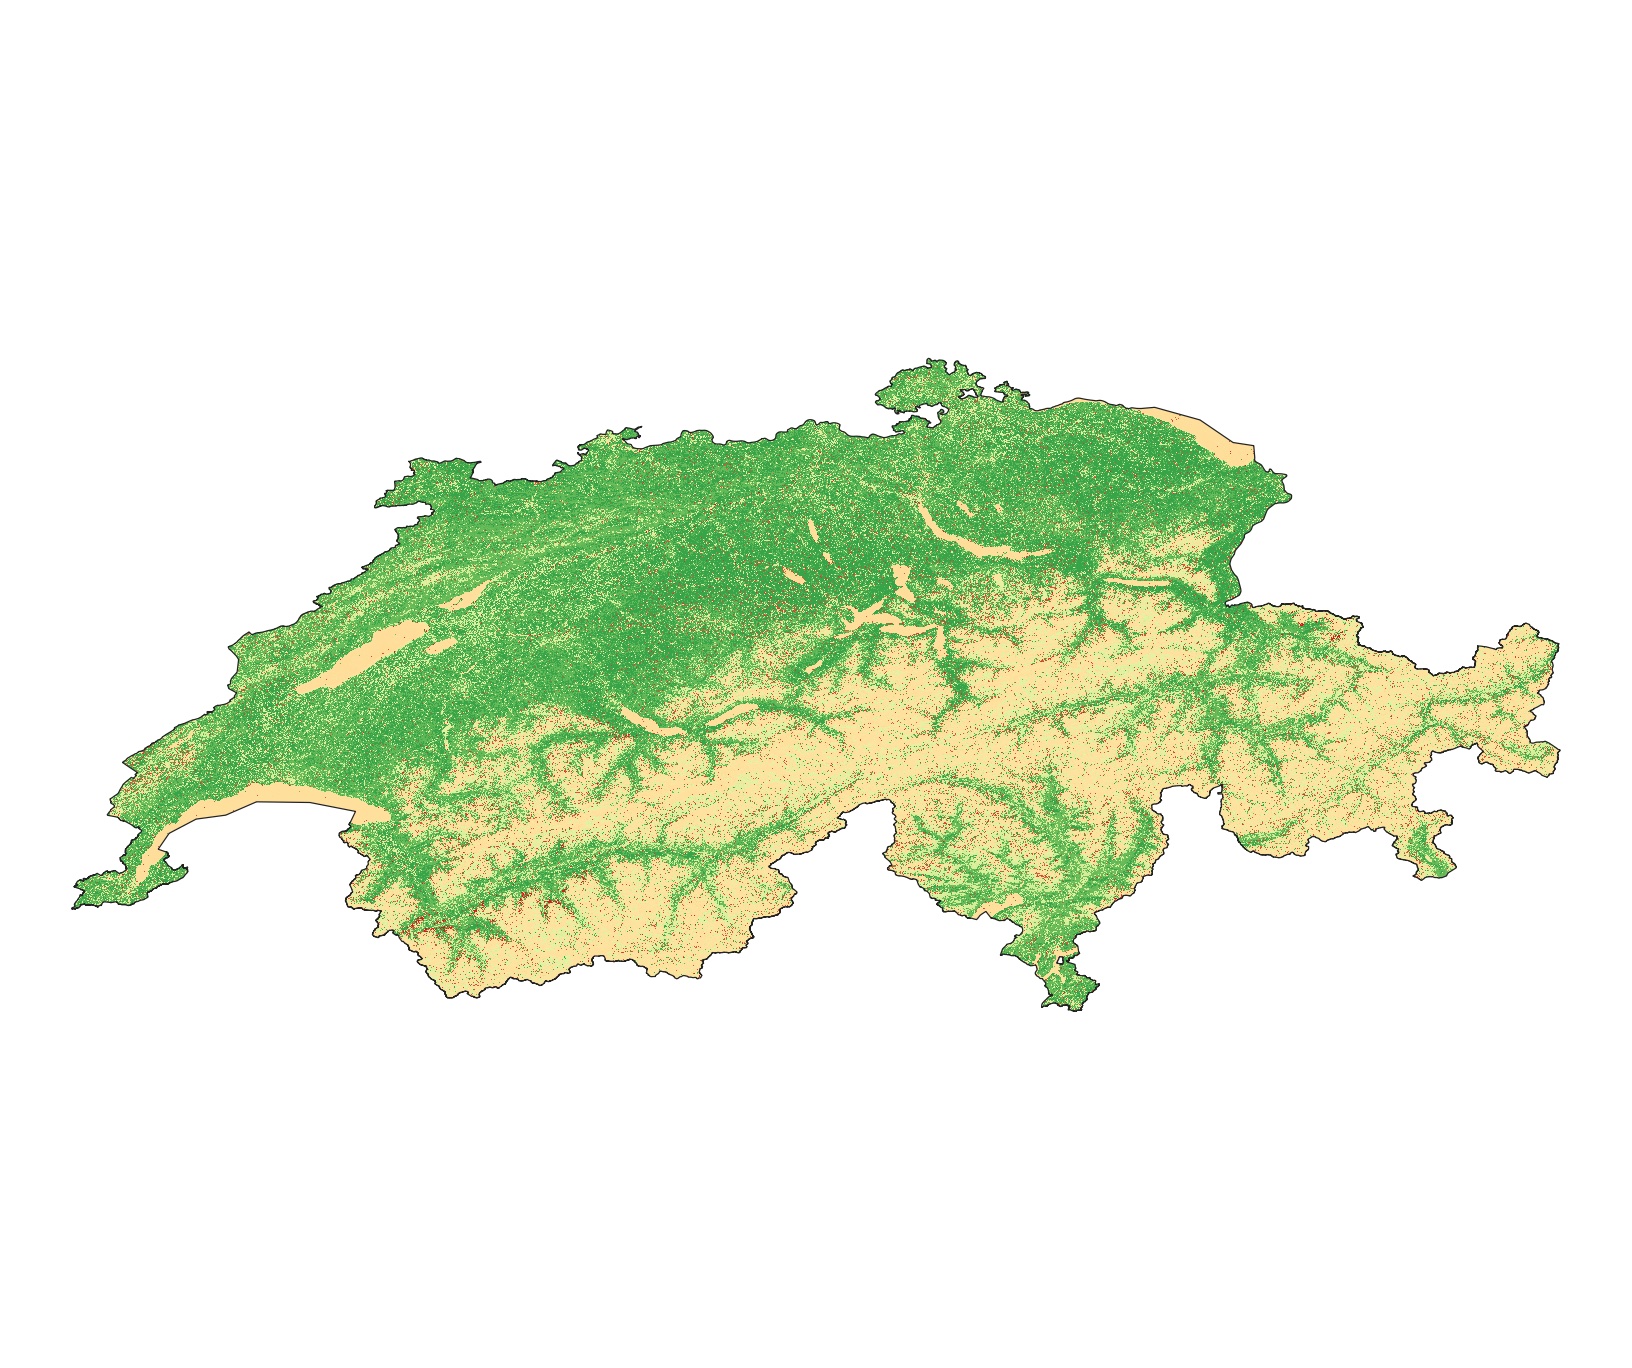
This dataset is an time-serie of Sentinel-2 Analysis Ready Data (ARD)- derived Enhanced Vegetation Index (EVI) computed from Sentinel-2 data. EVI quantifies vegetation by measuring the difference between near-infrared (which vegetation strongly reflects) and red light (which vegetation absorbs) using the forumla EVI=2.5*(b8 − b4)/(b8 + 6*b4 − 7.5*b2 + 1). See Huete et al. (2002) DOI: 10.1016/S0034-4257(02)00096-2 EVI is usually used for areas with high LAI where NDVI is expected to saturate. EVI is used to quantify vegetation greenness and is useful in understanding vegetation density and assessing changes in plant health. EVI values ranges from -1 to +1. Values are provided as integer and multiplied by 1000 Metrics: annual (_annual) and seasonal (_spring; _summer; _autumn; _winter) mean (_nanmean), standard dev (_nanstd), min (_nanmin), max (_nanmax), median (_nanmedian), and amplitude (_range) Data format: GeoTiff
-
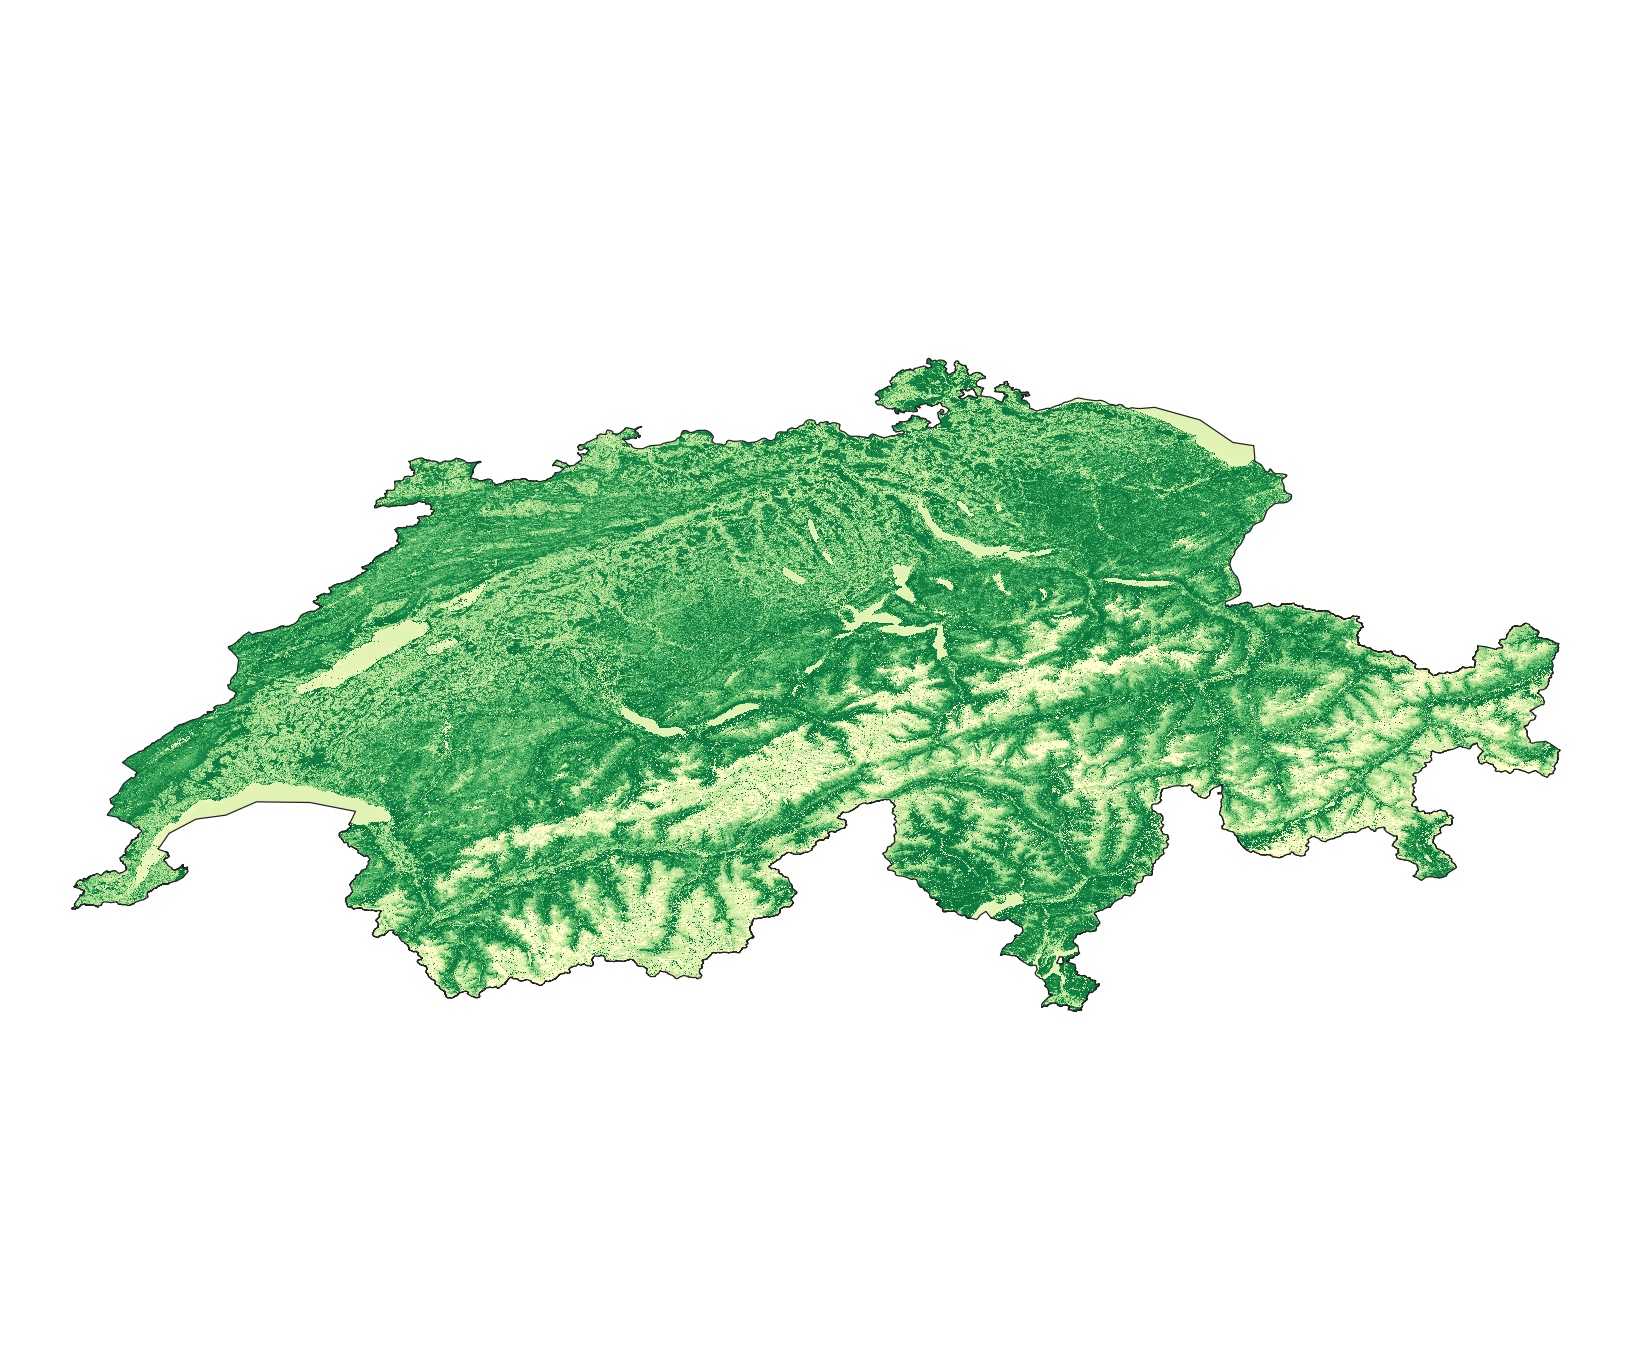
This dataset is an time-serie of Landsat Analysis Ready Data (ARD)- derived Leaf Area Index (LAI) computed from Landsat 5-7-8 data. LAI is designed to analyze the foliage surface of our planet and it estimates the quantity of leaves in a specific region using the forumla LAI= 3.618*EVI - 0.118. For more details see Boegh et al. (2002) DOI: 10.1016/S0034-4257(01)00342-X LAI is a unitless measure that is calculated as the ratio of the one-sided (illuminated) foliage area to the soil surface it can cover. This vegetation index is important to monitor crop and forest health, the environment, and climatic conditions. Values are provided as integer and multiplied by 1000 Metrics: annual (_annual) and seasonal (_spring; _summer; _autumn; _winter) mean (_nanmean), standard dev (_nanstd), min (_nanmin), max (_nanmax), median (_nanmedian), and amplitude (_range) Data format: GeoTiff
-
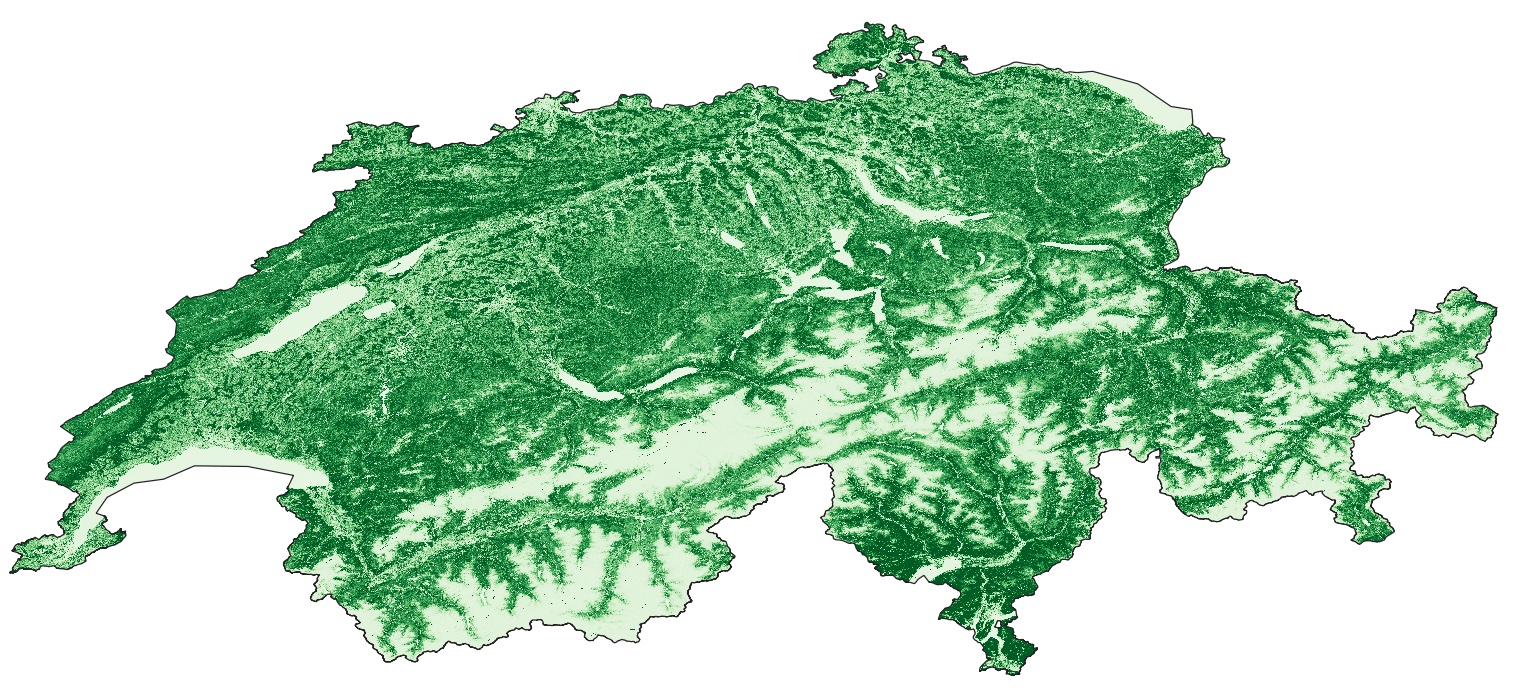
This dataset is an time-serie of Sentinel-2 Analysis Ready Data (ARD)- derived Green Chlorophyll Vegetation Index (GCI) computed from Sentinel-2 data. GCI is used to estimate the content of leaf chlorophyll in various species of plants using the forumla GCI=(b8/b3) – 1. See Gitelson et al. (2003) DOI: 10.1029/2002gl016450 The chlorophyll content reflects the physiological state of vegetation; it decreases in stressed plants and can therefore be used as a measurement of vegetation health. GCI values ranges from -1 to +1. Values are provided as integer and multiplied by 1000 Metrics: annual (_annual) and seasonal (_spring; _summer; _autumn; _winter) mean (_nanmean), standard dev (_nanstd), min (_nanmin), max (_nanmax), median (_nanmedian), and amplitude (_range) Data format: GeoTiff
-
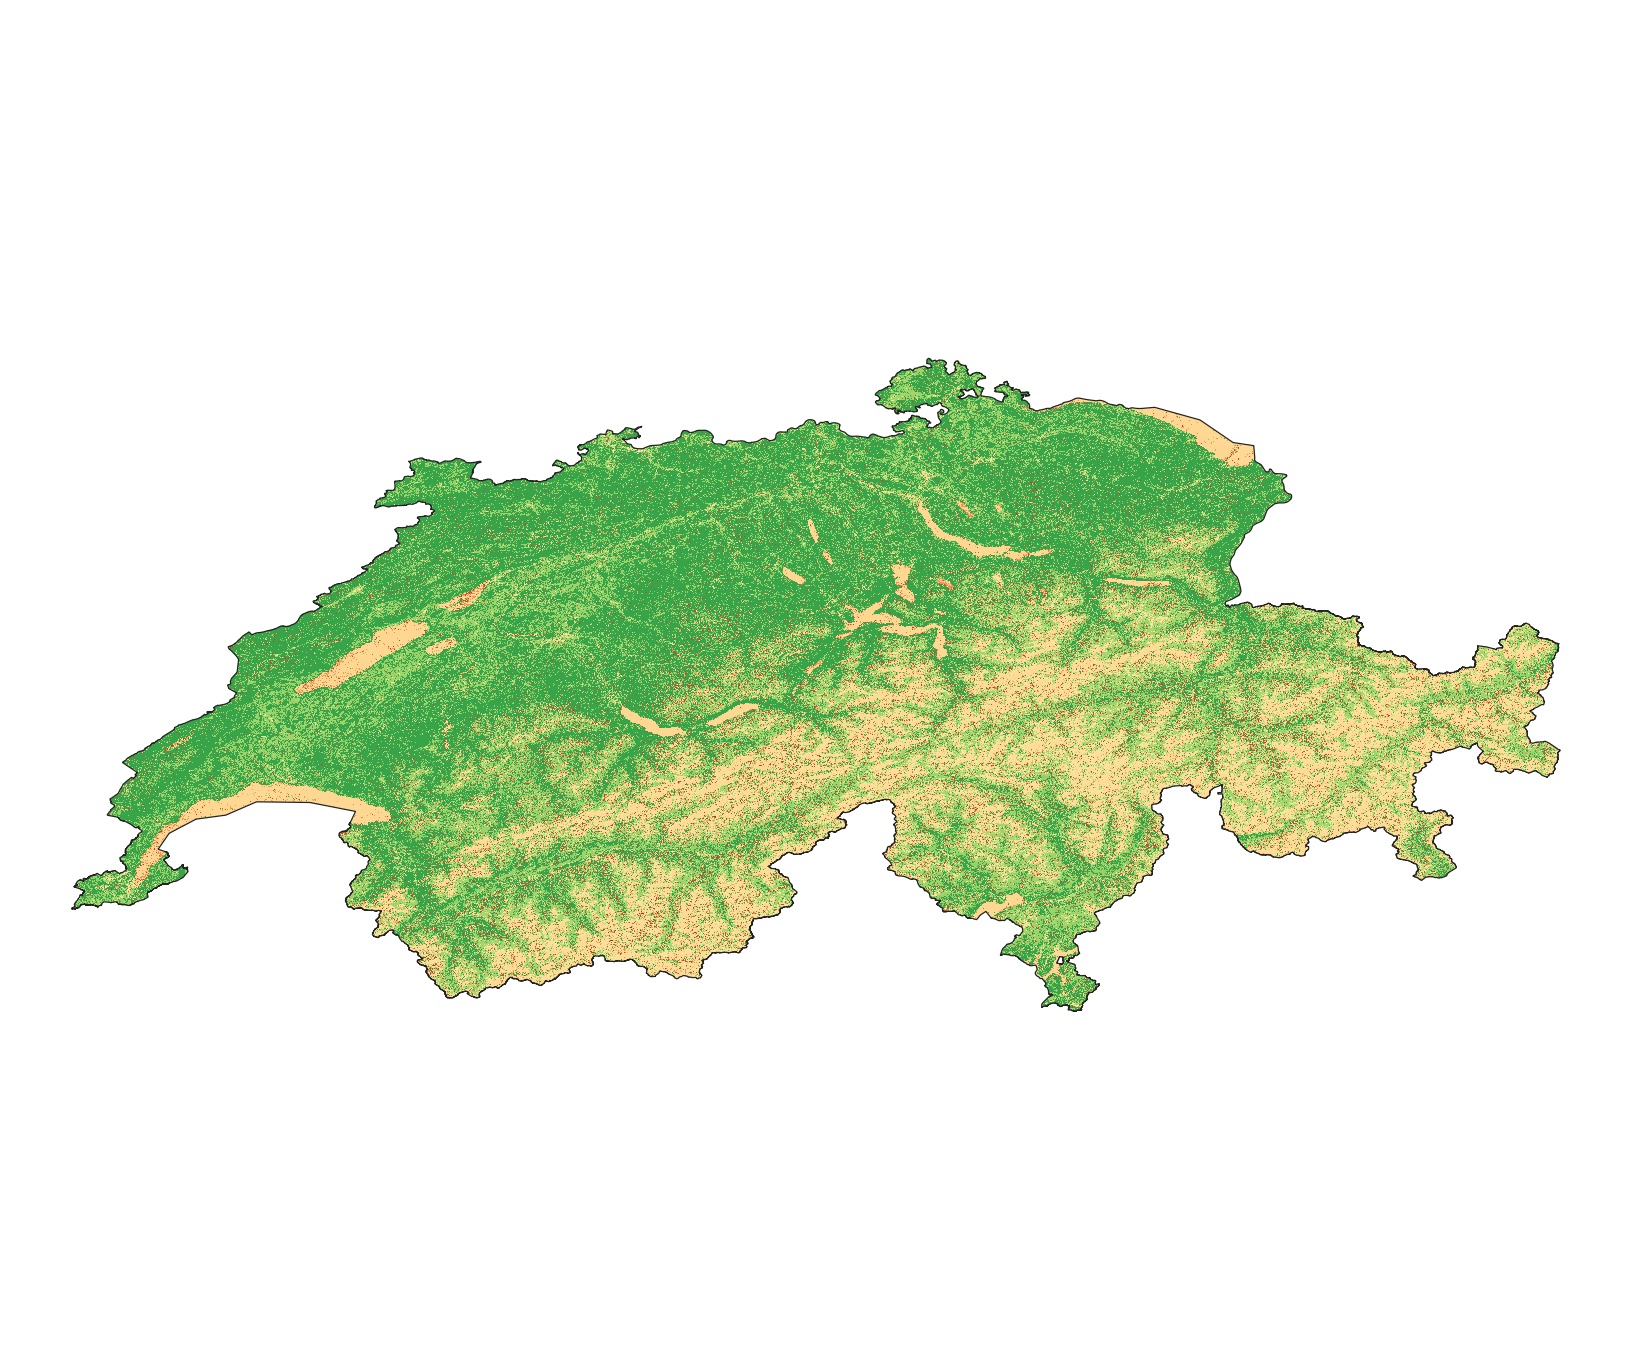
This dataset is an time-serie of Landsat Analysis Ready Data (ARD)- derived Enhanced Vegetation Index (EVI) computed from Landsat 5-7-8 data. EVI quantifies vegetation by measuring the difference between near-infrared (which vegetation strongly reflects) and red light (which vegetation absorbs) using the forumla EVI=2.5*(NIR − Red)/(NIR + 6*Red − 7.5*Blue + 1) . See Huete et al. (2002) DOI: 10.1016/S0034-4257(02)00096-2 EVI values ranges from -1 to +1. Values are provided as integer and multiplied by 1000 Metrics: annual (_annual) and seasonal (_spring; _summer; _autumn; _winter) mean (_nanmean), standard dev (_nanstd), min (_nanmin), max (_nanmax), median (_nanmedian), and amplitude (_range) Data format: GeoTiff
-

This dataset is the Landsat 7 Analysis Ready Data (ARD) - Level 2 (surface reflectance) archive for Switzerland. Detailed description about the Landsat 7 mission can be found in the CEOS Earth Observation Handbook: http://database.eohandbook.com/database/missionsummary.aspx?missionID=349 The Landsat archive is extremely interesting because this is the longest EO program, initiated in 1972, it has provided continual and consistent observations for almost 50 years. Since 2008, the complete data archive has been provided under a free and open access policy. This has enabled dense time-series analysis, moving beyond simple diachronic comparison of a set of images, therefore dramatically improving capabilities to monitor environmental changes. To cover the whole of Switzerland, it requires eight Landsat 7 scenes (Path/Row: 193/027, 194/027, 195/027, 196/027, 193/028, 194/028, 195/028, 196/028) representing an area of latitude 44.9 to 48.7 and longitude 4.1 to 12.8. Data are downloaded as Collection 1/Tier 1 – Level 2 Surface Reflectance encompassing a surface of approximately 185km by 180km. Collection 1/Tier 1 scenes are data with the highest available data quality (e.g., geometric and radiometric corrections) and considered suitable for time-series analysis (https://www.usgs.gov/land-resources/nli/landsat/landsat-collection-1). Level 2 corresponds to surface reflectance (i.e., the estimate based on Landsat sensor observations of the fraction of incoming solar radiation reflected from Earth’s surface). These data are corrected for atmospheric perturbations (e.g., aerosol scattering, thin clouds) enabling direct comparison between multiple images and dates. This corresponds to the ARD level. The sensor’s Scan-Line Corrector (SLC) failed in July 2003 and approximately 225 of the pixels per scene have since then not been scanned. However, the spatial and spectral quality of the remaining 78% of pixels images remain valid. Landsat data are provided by USGS with Quality Assessment (QA) information to help users to determine their suitability for specific applications. An 8-bit LandsatLook Quality Image and 16-bit Quality Assessment Band40 are also included. Details on each file are described at: https://www.usgs.gov/land-resources/nli/landsat/landsat-collection-1-level-1-quality-assessment-band. Level 2 products are generated by the USGS from level 1 product and using the official LEDAPS/LASRC algorithm. "A Pixel Quality Assurance (pixel_qa) band is provided with all Landsat Surface Reflectance-derived Spectral Indices. The band is in unsigned 16-bit format, values are bit-packed and provide information pertaining to a pixel condition of fill, clear, water, cloud shadow, snow, cloud (yes/no), cloud confidence and cirrus cloud confidence (Landsat 8 only)" https://www.usgs.gov/land-resources/nli/landsat/landsat-sr-derived-spectral-indices-pixel-quality-band.
-

This dataset is the Sentinel-1 Analysis Ready Data (ARD) archive for Switzerland. Detailed description about the Sentinel-1 missions can be found in the CEOS Earth Observation Handbook: Sentinel-1A (http://database.eohandbook.com/database/missionsummary.aspx?missionID=575) and Sentinel-1B (http://database.eohandbook.com/database/missionsummary.aspx?missionID=576). To produce Sentinel-1 Analysis Ready Radiometrically Terrain Corrected (RTC) products, ground range detected (GRD) products are downloaded from the EU scihub.copernicus.eu. A digital elevation model (DEM) is then used to generate an image simulation of the local contributing area within each image sample. That area is used to normalise the backscatter (rather than the ellipsoid model otherwise typically used) in ground range geometry. Then that normalized backscatter is terrain-geocoded (orthorectified) into the chosen map coordinates, producing a level-1 RTC product. Sets of multiple RTC products acquired from different orbit tracks within a tight temporal window are then combined using local resolution weighting into level-3 multitemporal backscatter composite products. The region covered is latitude 44.5 to 48.5N, longitude 5.5-11E, at 90m spatial resolution and 6 day temporal spacing. The geometry of Sentinel-1 data is well calibrated: data can be geocoded without any tiepoints to an accuracy of a few centimeters , far better than is possible with optical sensors. Sentinel-1 radiometric stability is monitored and calibrated within the Sentinel-1 Mission Performance Centre. A broad review of the quality of multiple implementations of radiometric terrain correction (RTC) processing was provided in. The quality of the terrain correction and radiometric corrections depends on the quality of the input DEM made available. Participants in the Copernicus programme (currently not including Switzerland) are able to access a world-wide high-quality DEM with 30m resolution, with 10m models available in some regions.
-
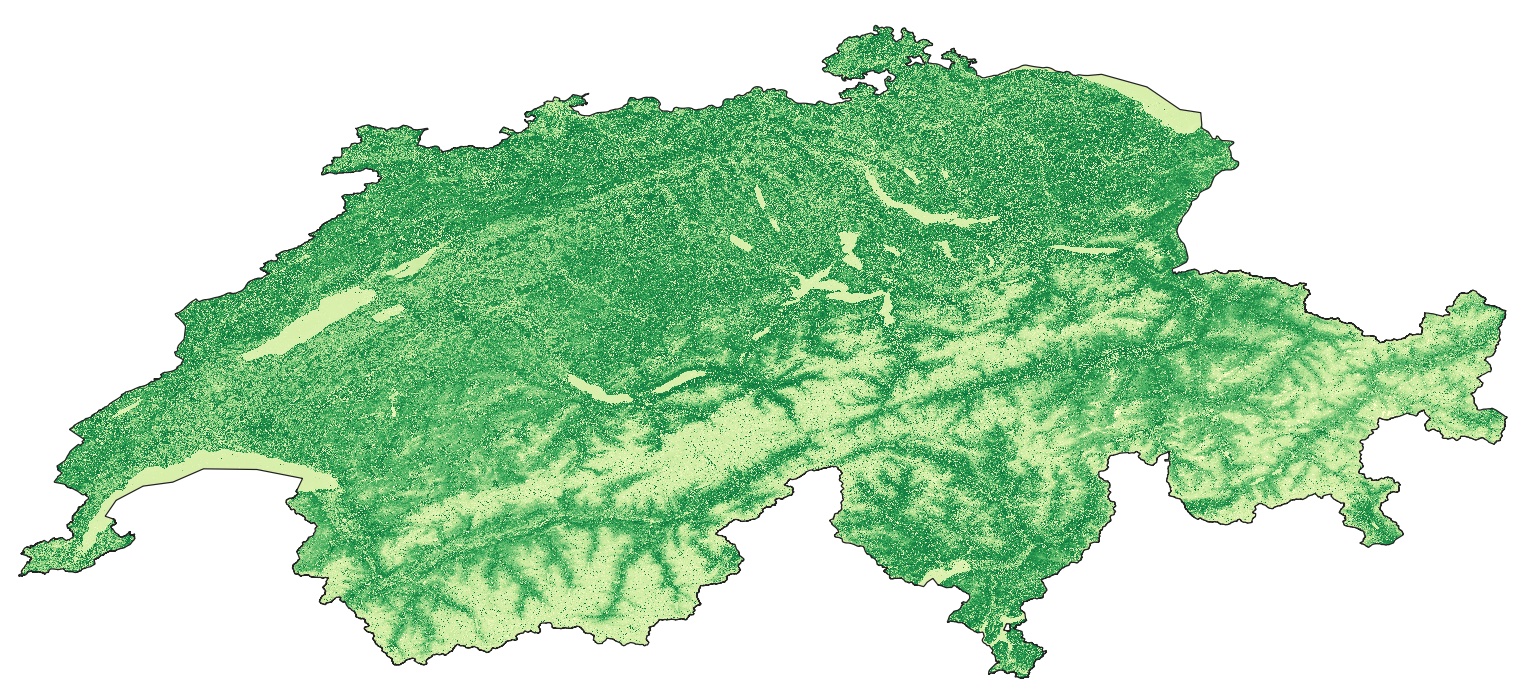
This dataset is an time-serie of Sentinel-2 Analysis Ready Data (ARD)- derived Leaf Area Index (LAI) computed from Sentinel-2 data. LAI is designed to analyze the foliage surface of our planet and it estimates the quantity of leaves in a specific region using the forumla LAI= 3.618*EVI - 0.118. For more details see Boegh et al. (2002) DOI: 10.1016/S0034-4257(01)00342-X LAI is a unitless measure that is calculated as the ratio of the one-sided (illuminated) foliage area to the soil surface it can cover. This vegetation index is important to monitor crop and forest health, the environment, and climatic conditions. Values are provided as integer and multiplied by 1000 Metrics: annual (_annual) and seasonal (_spring; _summer; _autumn; _winter) mean (_nanmean), standard dev (_nanstd), min (_nanmin), max (_nanmax), median (_nanmedian), and amplitude (_range) Data format: GeoTiff
-
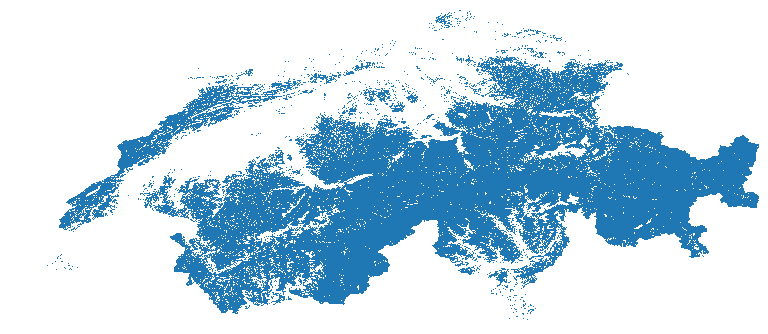
This dataset is a time-series of monthly snow cover maps over Switzerland computed from Landsat & Sentinel-2 Analysis Ready Data (ARD) for December 1984 to December 2021 These maps quantify the presence/absence of snow using the Snow Observation from Space algorithm developed by Poussin et al. in: https://doi.org/10.1016/j.srs.2023.100078 and in a submitted paper (Snow Observation from Space: An approach to map snow cover from four decades of Landsat and Sentinel-2 imageries across Switzerland). Snow cover is an Essential Climate Variables (ECV) playing a significant role in the climate system due to its high albedo and heat insulation. Snow cover also contributes to soil moisture and runoff, making it a crucial variable for monitoring climate change. Values ranges from 0 to 2. The monthly snow cover products have values ranging from 0 to 2 with the following classification for each pixel: • 0 when the pixel is snow-free (i.e., land), • 1 when the pixel is covered with snow, • 2 when the pixel is covered with clouds (including cloud shadow), • NA when the pixel is classified as water or lies outside of Switzerland. Data format: GeoTiff
 SwissEnvEO